
UrDI Canaan Area: Neighbourhood Plan for Canaan V
Summary — This UN-Habitat UrDI document is part of the 2016 planning package for the Canaan area of Port-au-Prince. It provides urban analysis, planning guidance or neighborhood-level proposals for Canaan V within the Croix-des-Bouquets metropolitan expansion area.
Key Findings
- Adds UrDI planning coverage for Canaan V.
- Links settlement growth to land-use, infrastructure and risk planning.
- Belongs to the 2016 Canaan-area planning package.
- Tagged to Croix-des-Bouquets/Ouest rather than Port-au-Prince commune.
Full Description
Prepared under the Urban Development Initiative for the Canaan area, the document addresses rapid urban growth, land use, infrastructure, risk and settlement planning in and around Canaan V. It should be read with the broader Canaan diagnostic, strategic framework and urban structure plan.
Full Document Text
Extracted text from the original document for search indexing.
UrDI - Urban Structure Plan
3.5. CANAAN V
1
2
3
4
Section A
5
No-Built areas
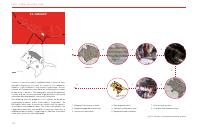
Canaan V is one the smallest neighbourhoods in terms of area.
Located in the centre, just north to Canaan III, this neighbourhood has 7,695 inhabitants. Due to lack of information, the calculation of the population was done by multiplying the number
of houses by 4 persons. The topography around the periphery
is steep, and we can only see some large plateaux in the centre
where possible development can actually take place.
The following land use proposals in this section are based on
a participatory process within three months’ time-frame. The
UN-Habitat team maps the existing situation and the community validates and proposes ideas. The urban Lab rechecks the
suggested interventions and modifies if necessary. After that, a
neighbourhood assembly is organized to showcase the overall
vision and a land use is later developed.
8
7
6
1. Mapping the existing situation
4. New proposals draft
7. Draft of land use plan
2. Mapping proposed interventions
5. Selected interventions map
8. Charrette and implementation
3. Community workshops
6. Neighbourhood assemblies
Fig.126: Canaan V: participatory planning process
102
U r b a n D e v e l o p m e n t I n i t i a t i v e ( U r D I ) f o r C a n a a n a r e a o f Po r t - A u - P r i n c e
A. STREET NETWORK
The existing street network covers only the central area of the neighbourhood. At the limits, the slopes
becomes very steep limiting any construction or extension of the network. For these areas, specific measures were elaborated in the mobility report giving a guidance on how to build roads in steep areas. The
existing road network is not well structured and not hierarchized. If the growth stays of 4% yearly, Canaan
V will be highly congested due to the lack of roads.
The new plan proposes of having an arterial road that crosses the plateau of the neighbourhood
and connects Canaan IV with Canaan I. This road will induce economic potentialities and enhance
accessibility to new job opportunities. The central area will be interconnected with secondary roads
where the topography allows it. Different width for the different types of roads are defined (A
and B, see below). It is not only suggested to propose new roads, but the upgrading of the existing ones is highly recommended. The street network of Canaan V will witness an increase of just
1.36% due to the complexity of the terrain.
Existing situation
Proposed street network
Streets percentage
Streets percentage
11.36% -Option A
UN-Habitat: 30%
Arterial road: 24m
Main roads: 18m
Secondary streets: 12m
10%
- Option B
Arterial road: 18m
Main roads: 12m
Secondary streets: 9m
Streets km/sq.km
UN-Habitat: 18 km/sq.km
17 km/sq.km
Fig.127: Canaan V: existing street network
Fig.128: Canaan V: Proposed street network
Layers of the proposed street network
National road
Arterial road
Main roads
Secondary streets
Fig.129: Canaan V: Layers of the proposed street network
103
UrDI - Urban Structure Plan
B. PUBLIC SPACES
Existing Public Spaces
Proposed by the community
Fig.130: Canaan V: Existing Public spaces
#
PUBLIC SPACE IN CANAAN V
STATUS
NAME
Neighbourhood area
1
Public space
Proposed by the community
2
Public space
Proposed by the community
Place Preval
Proposed by UN-Habitat LAB
Fig.131: Canaan V: Public spaces proposed by the community
m2
Ha
578644
57
135
0.0135
408
0.0408
543
0.05
%
100%
0.09%
Canaan V doesn’t have any public spaces within its boundary,
therefore more spaces should be allocated for the public good
in the new plan in order to reach the UN-Habitat recommendations. It is essential to consider vacant lands and preserve them
for the creation of new public spaces.
Two public spaces were proposed by the community during the
participatory approach. These spaces only form 0.1% of the total
area. Since the percentage is still low, UN-Habitat proposed the
allocation of ten other spaces which are spread equitably in the
neighbourhood. Adding the propositions of the community and
the LAB to the current situation, the percentage only increase by
1%.
3
Public space
Proposed by the Lab
673
0.0673
4
Public space
Proposed by the Lab
984
0.0984
5
Public space
Proposed by the Lab
464
0.0464
6
Public space
Proposed by the Lab
246
0.0246
7
Public space
Proposed by the Lab
875
0.0875
8
Public space
Proposed by the Lab
1.357
0.1357
9
Public space
Proposed by the Lab
964
0.0964
10
Public space
Proposed by the Lab
509
0.0509
12
Public space
Proposed by the Lab
349
0.0349
6.421
0.64
1.11%
6.964
0.7
1.2%
104
Fig.132: Canaan V: Public spaces proposed by UN-Habitat LAB
Table 21. Canaan V: Percentage of public spaces
U r b a n D e v e l o p m e n t I n i t i a t i v e ( U r D I ) f o r C a n a a n a r e a o f Po r t - A u - P r i n c e
In the new plan, the public spaces are well spread inside Canaan V. Adopting the 400 metres buffer zone recommended by
UN-Habitat, the neighbourhood seems to have enough of public
spaces despite the low percentage. This reflect that the number
of public spaces does not have to reach 15% every time in each
neighbourhood, but it has to be examined in its wider area.
#
OPEN SPACES IN
CANAAN V
m2
Ha
%
Neighbourhood
area
578644
57
100%
Public spaces
6964
0.7
1.2%
-
-
-
6964
0.7
1.2%
STATUS
-
NAME
-
-
TOTAL OPEN PUBLIC SPACE:
Proposed public spaces with 400 metres buffer
Existing public spaces
Proposed by the community
Proposed by UN-Habitat LAB
Table 22. Canaan V: Total percentage of public spaces
The World Health Organization (WHO) recommends 9m2/inhabitant
Existing
Proposed
public space
Proposed
P.S + non-aedificandi
0 m2
6964 m2
6964 m2
7695 Inhabitants
7695 inhabitants
7695 inhabitants
0 m2/Inhabitant
0.9 m2/inhabitant
0.9 m2/inhabitans
Table 23. Canaan V: Public space area per inhabitant diagram
Fig.133: Canaan V: Overall public spaces’ land use and buffer area (400m)
105
UrDI - Urban Structure Plan
C. RESIDENTIAL AREAS
0.58 km2
Proposed densities
Neighbourhood area
7,695
Inhabitants
Low density
(source ARC household survey 2016)
13,267
people/km2
Fig.135: Canaan V: Projected population increase
Existing residential areas
Most of the low density settlements are located where the slopes
are bit steep. As the density of the neighbourhood is already very
high, we have adopted to have 12,000 inhabitants/km2 in the
low density category. Canaan V will be able to host almost 2,525
people. The houses in this classification are usually connected via
secondary roads. It is possible to have small commerce if only it
they have access to pedestrian paths.
Medium density
The settlements of medium densities in the new plan are not
many. They are located in proximity of high density areas and
occupy only 15% of the total area. The topography in these areas is not steep and densification of previously low density areas
into medium is therefore feasible. The new design proposes of
having 18,000 inhabitants per km2 in low densities. Respecting
the proposal, 1,379 people will be accommodated in Canaan V
under this category.
High density
Fig.134: Canaan V: Existing settlements
Fig.136: Canaan V: Contours
In relation to its area, Canaan V is considered as a neighbourhood with high density. According to the American Red Cross
statistics, the population counts 21,119 inhabitants. After encountering many conflicts in the calculation, we have adopted to
multiply the number of houses per 4 people to get the total population. The topography in the neighbourhood limits any development or densification process to happen due to the presence
of the steep slopes on the periphery.
106
The location of high density settlements is concentrated where
the existing large plateaux are, and in proximity to the proposed
arterial road. UN-Habitat recommends a density of 15,000 inhabitants/km2 for this category, however due to the current high
density status, this neighbourhood will be exceptionally densified
having 24,000 inhabitants/km2. This means that a study on plots
resizing and modification and densification strategies should be
well conducted. Canaan V will be able to host 1,136 people. It is
generally advised to locate high density housing next to commercial areas in means to have a more compact city.
U r b a n D e v e l o p m e n t I n i t i a t i v e ( U r D I ) f o r C a n a a n a r e a o f Po r t - A u - P r i n c e
Fig.137: Canaan V: Diagram of population in the new proposed
residential areas.
In the upcoming 20 years, and if the population growth remains
of 4%, it is expected that the current population of 7,695 increases to 16,861 inhabitants. The densification, as proposed in
the new land use plan, will not be able to accommodate the
growth. Therefore it is essential to think of city extension plans.
The presence of economic activities in the residential areas is
highly encouraged on condition to have a direct access to the
roads. The size of commercial activities depends on the types
of roads and the density of the area; the higher the density, the
bigger the commerce and vice versa. The compactness of the city
is induced by the integration of different usages into the urban
fabric.
Low density
Medium density
High density
Fig.138: Canaan V: Residential areas and proposed densities
107
UrDI - Urban Structure Plan
D. COMMERCIAL AREAS
Existing commercial
Proposed commercial areas (mixed-use)
29
9.5%
Existing
commercial
points
(of the total
neighbourhood area)
(source OSM)
Proposed Commercial and mixed use areas
0
500
1000m
produced 03.11.2016
Fig.139: Canaan V: Existing commercial points (Source: OSM)
Fig.140: Canaan V: Proposed commercial areas
According to OpenStreetMap data, there are 29 commercial stores. The location of these services is very important as they play a big role in the economic dynamics and the employment
opportunities in the neighbourhood. Placing them next to arterial and main roads is encouraged. The commercial activities has to be considered when studying the accessibility to other
functions, especially to roads, public spaces and housing.
In the new proposal, the commercial activities will be located in the area that faces the new
arterial road. They will occupy the ground floor and will have access to pedestrian paths.
These activities have the potential to generate a new, highly diverse sector within the local
economy, with opportunities for job creation. They therefore act as catalysts for initiating a
structural transformation. The proposed commercial areas will occupy 9.5%.
108
U r b a n D e v e l o p m e n t I n i t i a t i v e ( U r D I ) f o r C a n a a n a r e a o f Po r t - A u - P r i n c e
E. PUBLIC FACILITIES
Most of the educational facilities are located in the north of the
neighbourhood. From the results of the participatory approach,
most of the kids are enrolled in schools in within Canaan V. The
data has been validated with the community but there is still a
lack of information about the types of schools (primary, secondary, etc.). It was a challenge to predict the required number of
facilities for the population. Education plays a major role in reducing poverty and inequality. For that, it is always advisable to
reserve certain land for the extension of existing facilities and/or
for the provision of new schools.
RELIGIOUS - EXISTING
EDUCATION - EXISTING
HEALTH - EXISTING
OTHER PUBLIC FACILITIES - EXISTING
Fig.141: Canaan V: Existing public facilities
and a 500m buffer catchment area.
15%
Less than 10 years
5%
Illiterate
27%
Primary school (not finished)
12%
Primary school (finished)
26%
Secondary school (not finished)
10%
Secondary school (finished)
3%
Professional school
3%
University
Table 24. Canaan V: Participation level (Croix Rouge Americaine,
Juillet 2016)
Religious facilities are concentrated in the centre. There are no
information available about health services, community centres,
security stations and others. For planning purposes, and in order
to have a long-term sustainable city, it is essential to consider the
services mentioned in the new design of the neighbourhood.
Generally, these services require good accessibility and therefore
their location must be well studied. Normally, it is recommended
to locate them within 500 metres from the settlements so that
they are easily accessible.
Fig.142: Canaan V: Existing public facilities
109
UrDI - Urban Structure Plan
F. NATURAL RESOURCES AND ENVIRONMENT
The natural and non-aedificandi areas form 7.6% of the total
neighbourhood area. All these spaces are prone to high environmental risks. To prevent any risk of flooding on built-up areas,
these zones will be classified as no-built areas where no construction should take place. The inhabitants that are already located in these risks zones will have to be relocated to safer areas.
#
14
No-built areas
m2
Ha
%
Neighbourhood area
578.644
57
100%
High environmental risk
areas
44,063
4.4063
44,063
4
7.61%
Table 25. Canaan V: Total percentage of no-built areas
Proposed buffer zone along the rivers and ravines
Proposed area for livestock grazing
Proposed area for reforestation
High environmental risk areas
Existing quarries
Existing rivers and ravines
Legend
Proposed buffer zone along the rivers and ravines
Proposed area for livestock grazing
Proposed area for reforestation
High environmental risk areas
0
500
1000m
produced 03.11.2016
Existing rivers and ravines
Quarries
110
Fig.143: Canaan IV: No-built areas
U r b a n D e v e l o p m e n t I n i t i a t i v e ( U r D I ) f o r C a n a a n a r e a o f Po r t - A u - P r i n c e
G. CANAAN V LAND USE
The assemblies, facilitated by the UN-Habitat team in Haiti, identified the main
needs of the residents of Canaan V. The proposed land-use plan is the result of
the ongoing participatory process with the community. It responds as much as
possible to their needs and proposes new ideas that can induce prosperity and
sustainability. Even though the plan addressed the issues of land uses and increase
the street network, the public spaces and commerce, public facilities however remain insufficient. An elaboration of the plan is essential once all the information
are provided. To ensure Canaan V sustainability, it is recommended not to further
densify it.
The plan was reviewed as a whole, taking into account the neighbourhoods nearby and how they connect. It is mandatory to situate each of the individual neighbourhood plans in the whole Canaan area to achieve a coherent and rich structure.
Fig.144: Canaan V: Proposed land use plan
111
How to cite
UN-Habitat; UCLBP, 2016, UrDI Canaan Area: Neighbourhood Plan for Canaan V, https://unhabitat.org/sites/default/files/2020/09/87._neighborhood_plans_en_canaan_v.pdf