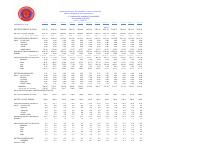
(FY2020) Haiti public external debt, Oct 2019-Sep 2020 (BRH data)
Summary — Monthly table from Haiti's Ministry of Economy and Finance (MEF), based on BRH data, tracking the stock of public external debt, including payment arrears, from October 2019 through September 2020. It breaks the debt down by bilateral and multilateral creditors and by share of total debt.
Key Findings
- Total public external debt rose from USD 2,102.23 million (Oct-19) to USD 2,199.30 million (Sep-20).
- Bilateral creditors, mostly Venezuela (USD 1,853.04 million, unchanged all period), held 87-91% of the total.
- IMF exposure roughly doubled from USD 74.52 million (Mar-20) to USD 186.30 million (Apr-20).
- Payment arrears rose from USD 269.86 million (12.8% of total) to USD 365.42 million (16.6% of total) between Oct-19 and Sep-20.
Full Description
This is a monthly statistical table produced by Haiti's Ministry of Economy and Finance (MEF), sourced from the Banque de la Republique d'Haiti (BRH), showing the aggregate stock of public-sector external debt (including payment arrears) for each month from October 2019 to September 2020, in millions of US dollars. Total external debt was long-term throughout the period, rising from USD 2,102.23 million in October 2019 to USD 2,203.03 million in April 2020 and standing at USD 2,199.30 million in September 2020. Bilateral creditors dominate the stock (around 87-91% of the total), overwhelmingly owed to Venezuela (USD 1,853.04 million throughout, split between the Bolivarian Republic of Venezuela at 1,826.24 million and PetroCaribe-related 'BANDES' financing at 26.80 million), with smaller amounts to Taiwan (Chine Taipei). Multilateral creditors (FMI/IMF, FIDA/IFAD, BID/IDB, OPEC, BIRD/IDA) account for the remainder, and IMF exposure roughly doubled between March and April 2020 (from USD 74.52 million to USD 186.30 million), consistent with a Rapid Credit Facility-type disbursement during the COVID-19 shock. Rescheduled debt ('dette reamenagee', owed to Taiwan) is small and declining, while arrears grew steadily across the period, from USD 269.86 million (12.8% of total debt) in October 2019 to USD 365.42 million (16.6% of total debt) by September 2020.
Full Document Text
Extracted text from the original document for search indexing.
MINISTERE DE L'ÉCONOMIE ET DES FINANCES
Oct-19Nov-19 Dec-19 Jan-20Feb-20Mar-20Apr-20May-20 Jun-20 Jul-20Aug-20Sep-20
En Millions de $ US
96.7%
DETTE EXTERNE TOTALE 2102.232100.492098.402095.322094.682091.202203.032201.552200.752204.482205.222199.30
DETTE A LONG TERME 2102.232100.492098.402095.322094.682091.202203.032201.552200.752204.482205.222199.30
% Ven % Dette Totale0.88 0.88 0.88 0.88 0.88 0.89 0.84 0.84 0.84 0.84 0.84 0.84
CREANCIERS BILATERAUX 1915.641915.641915.611915.611915.611915.611915.611915.611915.581915.581915.581913.72
DONT ETATS-UNIS 0.00 0.00 0.00 0.00 0.00 0.00 0.00 0.00 0.00 0.00 0.00 0.00
FRANCE 0.00 0.00 0.00 0.00 0.00 0.00 0.00 0.00 0.00 0.00 0.00 0.00
ESPAGNE 0.00 0.00 0.00 0.00 0.00 0.00 0.00 0.00 0.00 0.00 0.00 0.00
ITALIE 0.00 0.00 0.00 0.00 0.00 0.00 0.00 0.00 0.00 0.00 0.00 0.00
CHINE TAIPEI 62.60 62.60 62.57 62.57 62.57 62.57 62.57 62.57 62.54 62.54 62.54 60.68
REPUBLIQUE BOLIVARIENNE DU VENEZUELA1826.241826.241826.241826.241826.241826.241826.241826.241826.241826.241826.241826.24
BANDES 26.80 26.80 26.80 26.80 26.80 26.80 26.80 26.80 26.80 26.80 26.80 26.80
VENEZUELA 1853.041853.041853.041853.041853.041853.041853.041853.041853.041853.041853.041853.04
CREANCIERS MULTILATERAUX 178.78 177.04 176.14173.79173.15 170.37282.20280.72279.95284.41285.15281.09
BIRD/IDA 0.00 0.00 0.00 0.00 0.00 0.00 0.00 0.00 0.00 0.00 0.00 0.00
FIDA 48.91 48.68 47.86 47.66 47.45 47.17 47.22 47.41 46.37 47.62 47.81 47.35
FMI 80.52 79.01 79.59 77.44 77.01 74.52186.30185.94186.21189.42189.97186.37
BID 0.03 0.03 0.03 0.03 0.03 0.02 0.02 0.02 0.02 0.02 0.02 0.02
OPEC 49.32 49.32 48.66 48.66 48.66 48.66 48.66 47.35 47.35 47.35 47.35 47.35
DETTE REAMENAGEE 7.81 7.81 6.65 5.92 5.92 5.22 5.22 5.22 5.22 4.49 4.49 4.49
DONT ETATS-UNIS 0.00 0.00 0.00 0.00 0.00 0.00 0.00 0.00 0.00 0.00 0.00 0.00
FRANCE 0.00 0.00 0.00 0.00 0.00 0.00 0.00 0.00 0.00 0.00 0.00 0.00
CANADA 0.00 0.00 0.00 0.00 0.00 0.00 0.00 0.00 0.00 0.00 0.00 0.00
ESPAGNE 0.00 0.00 0.00 0.00 0.00 0.00 0.00 0.00 0.00 0.00 0.00 0.00
CHINE TAIPEI 7.81 7.81 6.65 5.92 5.92 5.22 5.22 5.22 5.22 4.49 4.49 4.49
ARRIERES 269.86 276.21 283.70290.85298.22 213.05220.37321.80331.35337.22347.42365.42
dont arr tech. env. Venezuela259.49 276.21 283.7 290.9 298.2
EN POURCENTAGE DE LA DETTE EXTERNE TOTALE
DETTE EXTERNE TOTALE 100.0 100.0 100.0 100.0 100.0 100.0 100.0 100.0 100.0 100.0 100.0 100.0
DETTE A LONG TERME 100.0 100.0 100.0 100.0 100.0 100.0 100.0 100.0 100.0 100.0 100.0 100.0
CREANCIERS BILATERAUX 91.1 91.2 91.3 91.4 91.5 91.6 87.0 87.0 87.0 86.9 86.9 87.0
DONT ETATS-UNIS 0.0 0.0 0.0 0.0 0.0 0.0 0.0 0.0 0.0 0.0 0.0 0.0
FRANCE 0.0 0.0 0.0 0.0 0.0 0.0 0.0 0.0 0.0 0.0 0.0 0.0
ESPAGNE 0.0 0.0 0.0 0.0 0.0 0.0 0.0 0.0 0.0 0.0 0.0 0.0
ITALIE 0.0 0.0 0.0 0.0 0.0 0.0 0.0 0.0 0.0 0.0 0.0 0.0
CHINE TAIPEI 3.0 3.0 3.0 3.0 3.0 3.0 2.8 2.8 2.8 2.8 2.8 2.8
REPUBLIQUE BOLIVARIENNE DU VENEZUELA86.9 86.9 87.0 87.2 87.2 87.3 82.9 83.0 83.0 82.8 82.8 83.0
BANDES 1.3 1.3 1.3 1.3 1.3 1.3 1.2 1.2 1.2 1.2 1.2 1.2
CREANCIERS MULTILATERAUX 8.5 8.4 8.4 8.3 8.3 8.1 12.8 12.8 12.7 12.9 12.9 12.8
BIRD/IDA 0.0 0.0 0.0 0.0 0.0 0.0 0.0 0.0 0.0 0.0 0.0 0.0
FIDA 2.3 2.3 2.3 2.3 2.3 2.3 2.1 2.2 2.1 2.2 2.2 2.2
FMI 3.8 3.8 3.8 3.7 3.7 3.6 8.5 8.4 8.5 8.6 8.6 8.5
BID 0.0 0.0 0.0 0.0 0.0 0.0 0.0 0.0 0.0 0.0 0.0 0.0
OPEC 2.3 2.3 2.3 2.3 2.3 2.3 2.2 2.2 2.2 2.1 2.1 2.2
DETTE REAMENAGEE 0.4 0.4 0.3 0.3 0.3 0.2 0.2 0.2 0.2 0.2 0.2 0.2
ARRIERES 12.8 13.1 13.5 13.9 14.2 10.2 10.0 14.6 15.1 15.3 15.8 16.6
SOURCE: BRH
DETTE EXTERNE DU SECTEUR PUBLIC
(Y COMPRIS LES ARRIERES DE PAIEMENT)
SOUS FORME AGREGEE
OCT 19 - SEPT 20