
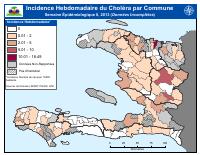
Weekly Cholera Incidence by Commune, Epidemiological Week 8, 2013
Summary: Choropleth map of cholera incidence by commune, cases per 10,000 population, for the epidemiological week ending 23 February 2013. Produced by the MSPP epidemiology directorate (DELR) from institutional reporting, with commune boundaries from CNIGS and population from IHSI. Communes are shaded in five bands, with separate shading for those that did not report and those with no health institution. The legend's top band reaches 18.49 cases per 10,000. The file also carries the week's case table by department and commune: population, cases seen, cases hospitalised, institutional deaths, community deaths, total deaths, hospital and overall case fatality, and the attack rate. The sheet is marked as incomplete data.
How to cite
Ministry of Public Health and Population (MSPP), Weekly Cholera Incidence by Commune, Epidemiological Week 8, 2013, https://mspp.gouv.ht/sites/default/files/publications/Rapport%20par%20commune%20sur%20le%20cholera%208eme%20semaine%20epidemiologique%202013.pdf