Full Document Text
Extracted text from the original document for search indexing.
Displacement situation in Haiti
Round 13 | May 2026
TheopinionsexpressedinthispublicationarethoseoftheauthorsanddonotnecessarilyreflecttheviewsoftheInternationalOrganizationforMigration(IOM).Thedesignationsemployed
andthepresentationofmaterialthroughoutthepublicationdonotimplyexpressionofanyopinionwhatsoeveronthepartofIOMconcerningthelegalstatusofanycountry,territory,cityor
area,orofitsauthorities,orconcerningitsfrontiersorboundaries.
IOMiscommittedtotheprinciplethathumaneandorderlymigrationbenefitsmigrantsandsociety.Asanintergovernmentalorganization,IOMactswithitspartnersintheinternational
communityto:assistinmeetingtheoperationalchallengesofmigration;advanceunderstandingofmigrationissues;encouragesocialandeconomicdevelopmentthroughmigration;anduphold
thehumandignityandwell-beingofmigrants.
ThispublicationwasmadepossiblethankstothefinancialsupportoftheUSDepartmentofState.Theopinionsexpressedhereinarethoseoftheauthorsanddonotnecessarilyreflectthose
oftheUSDepartmentofState.
Publisher:InternationalOrganizationforMigration
RueE.Pierre,11(ZoneAmbassadedesÉtats-Unis)
Tabarre27
Port-au-Prince,Haïti
Email:dtmhaiti@iom.int
Website:https://dtm.iom.int/haiti
ThispublicationwasissuedwithoutformaleditingbyIOM.ThispublicationwasissuedwithoutIOMPublicationsUnit(PUB)approvalforadherencetoIOM’sbrandandstylestandards.This
publicationwasissuedwithoutIOMResearchUnit(RES)endorsement
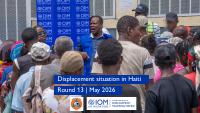
Coverphoto:Discussionswithinternallydisplacedpersonsinthecapitalduringhumanitarianassistance©IOMHaiti,May2026
Requiredcitation:InternationalOrganizationforMigration(IOM),May2026,DisplacementsituationinHaitiinMay2026–Round13.IOMHaiti.
These activities were
implemented with
the support of:
Data collection was carried out
with the participation of the
following state institutions:
2
TABLE OF CONTENTS 3
SUMMARY
ANALYSESABOUTINTERNALLYDISPLACEDPERSONS
DISAGGREGATIONBYAGEANDSEX
HOSTLOCATIONSFORINTERNALLYDISPLACEDPERSONS
DISPLACEMENTTRENDS
ORIGINSOFINTERNALLYDISPLACEDPERSONS
FOCUSONTHEMETROPOLITANAREAOFPORT-AU-PRINCE
FOCUSONTHEMUNICIPALITIESOFTHEWEST(OUTSIDETHEMETROPOLITANAREAOFPORT-AU-PRINCE)
FOCUSONTHEFOURDEPARTMENTSOFTHEGREATSOUTH
FOCUSONTHEARTIBONITEDEPARTMENT
FOCUSONTHECENTREDEPARTMENT
FOCUSONTHETHREEDEPARTMENTSOFTHEGREATSOUTH
ANALYSESABOUTRETURNEES(FORMERINTERNALLYDISPLACEDPERSONS)
RETURNAREASOFRETURNEES
FOCUSONTHEMETROPOLITANAREAOFPORT-AU-PRINCE
FOCUSONTHECENTREDEPARTMENT
PRIORITYNEEDS
ANNEX1.METHODOLOGY
4
8
9
10
12
13
15
16
17
18
19
21
22
23
24
26
4
SUMMARY
1,466,862
internally displaced persons (IDPs)
(12% of the Haitian population)
345,934
displaced
households
IncreaseinthenumberofIDPscomparedtoRound12
(December2025)+1%
84%
of IDPs are in host
families/out of sites
16%
are in sites
262
spontaneous sites
(33 more compared to Round 12)
43%of IDPs are hosted in only 10municipalities :
Port-au-Prince (in the department of the West, with 11% of IDPs in the
country); Delmas (West, 6%); Jacmel (South-East, 5%); Verrettes (Artibonite,
4%); Cap Haïtien (North, 3%); Léogâne (West, 3%); Les Cayes (South, 3%)
Belladère (Centre, 3%); Aquin (South, 3%) and Hinche (Centre 2%)
1.The term "provinces" refers to all areas of the country outside the Metropolitan Area of Port-au-Prince (MAPAP), the capital. The MAPAP consists of the municipalities of Port-au-Prince, Delmas, Cité Soleil, Pétion-Ville, Carrefour, Tabarre, and Croix-des-Bouquets.
112sites in the capital, hosting 213,168 IDPs
(+8% compared to Round 12)
150sites in provinces, hosting 19,228 PDI
(-4% compared to Round 12)
21%of IDPs are hosted in the capital.
79%of IDPs are hosted in provinces.
1
165,937
Returned persons
35,631
Returned households
+89%
Increase in the number of returnees compared to
Round 12
BetweenRound12(December2025)andRound13(May2026),
thetotalnumberofIDPsincreasedslightlyby1percent.This
slightincreasemaskssignificantregionaldynamics:
▪TheMetropolitanAreaofPort-au-Princesawariseof6per
cent,exceeding300,000IDPsforthefirsttime,mainlydueto
clashesinCitéSoleil.
▪Artiboniterecordeda5percentincreaseduetorecurrent
attacks.
▪Atthesametime,thenumberofreturneesjumpedby89per
cent,withsharpincreasesinthecapital(+41%),the
municipalitiesoftheWestoutsidethecapital(+1,366%),and
theCentre(+125%).Thesereturnsexplainthedecreasesin
thenumberofIDPsobservedintheCentre(-10%)andthe
North(-13%).Overall,withoutthesenewreturns,the
numberofIDPsinthecountrywouldhaveincreasedby
95,000peoplebetweenRounds12and13:
▪94,945peoplehavebeennewlydisplaced,and
78,337havereturnedtotheirareasofresidence
4
Host regions
# of displaced
households
# of IDPs % of IDPs
West (30%)
MAPAP 82,140 309,716 21%
Outside MAPAP27,571 129,053 9%
Great South(39%)
South 44,203 193,965 13%
South-East 38,738 175,231 12%
Grande'Anse 29,286 123,080 9%
Nippes 18,170 72,753 5%
Artibonite (11%) 34,090 158,358 11%
Centre (10%) 35,627 146,739 10%
Great North (10%)
North 26,275 117,032 8%
North-West 4,807 20,862 1%
North-East 5,027 20,073 1%
TOTAL 345,934 1,466,862 100%
This map is for illustration purposes only. Names and boundaries on this map do not imply official endorsement or acceptance by IOM.
Table 1. NumberandproportionofIDPsbyhostarea
Map 1. IDPs by department
Table 2. IDPsoutsidesites/withhostfamiliesvs.insites,byhostarea
Host regions # of IDPs
% of IDPs out of
sites
% of IDPs in
sites
# of sites
West
MAPAP 309,716 31% 69% 112
Outside MAPAP129,053 98% 2% 14
Great South
South 193,965 100% 0% 0
South-East175,231 100% 0% 0
Grande'Anse123,080 100% 0% 0
Nippes 72,753 100% 0% 0
Artibonite (11%) 158,358 95% 5% 65
Centre (10%) 146,739 95% 5% 66
Great
North
North 117,032 99.6% 0.4% 4
North-West 20,862 100% 0% 0
North-East20,073 99% 1% 1
TOTAL 1,466,862 84% 16% 262
Internally Displaced Persons 5
Areas of return
# of returned
households
# of returned
individuals
% of returned
individuals
West (57%)
MAPAP 11,765 50,920 31%
Outside MAPAP 9,188 42,812 26%
Great South (11%)
South 2,727 12,412 7%
South-East 0 0 0%
Grande'Anse 1,400 6,340 4%
Nippes 0 0 0%
Artibonite (6%) 1,770 9,488 6%
Centre (25%) 8,205 41,280 25%
Great North (1%)
North 76 380 0,2%
North –West 500 2,305 1%
North -East 0 0 0%
TOTAL 35,631 165,937 100%
Thismapisforillustrationpurposesonly.NamesandboundariesonthismapdonotimplyofficialendorsementoracceptancebyIOM
Table 3. Numberandproportionofreturnees(formerIDPs)byreturnareaMap 2. ReturneesformerlyIDPs,bydepartment
Returnees – formerly internally displaced 6
ANALYSES ABOUT INTERNALLY DISPLACED PERSONS
DistributionofNon-FoodItemstointernallydisplaced
personsinthecapital© IOM Haiti, May 2026
3%
6%
9%
11%
21%
4%
3%
5%
8%
10%
16%
4%
<1
1 - 5
6 - 11
12 - 17
18 - 59
60+
1%
4%
5%
8%
31%
5%
1%
3%
5%
7%
26%
4%
<1
1 - 5
6 - 11
12 - 17
18 - 59
60+
3%
6%
8%
11%
22%
4%
2%
5%
7%
9%
19%
4%
<1
1 - 5
6 - 11
12 - 17
18 - 59
60+
Disaggregation by age and sex of
internally displaced persons
Graph1.DisaggregationbyageandsexofIDPs
Graph2.DisaggregationbyageandsexofIDPsresidinginsites
Graph3.DisaggregationbyageandsexofIDPsresidingoutsidesites
Female
(54%)
Male
(46%)
Female
(54%)
Male
(46%)
Female
(54%)
Male
(46%)
ThedemographiccompositionofInternallyDisplacedPersons(IDPs)remainsthesame
comparedtopreviousassessments:morethanhalf(54%)arewomen(adultsandminors),and
childrenrepresent51percentofallIDPs.Furthermore,apersistentdifferencebetweenIDPs
livinginsitesandthoseresidingoutsidesitescontinuestobeobserved:insites,adultsarethe
majority(66%versus34%children),whileoutsidesites,childrenconstitutethemajorityofIDPs
(55%versus45%adults).Thisdisparityismainlyexplainedbytheseverityoflivingconditionsin
sites,whichleadsmanydisplacedpersonstoentrusttheirchildrentorelatives,oftensending
themfromthecapitaltotheprovinces.
8
Host locations for internally displaced persons
MunicipalityDepartment# of IDPs
% of IDPs in
the country
Port-au-
Prince
Ouest160 17611%
DelmasOuest83 059 6%
JacmelSud-Est71 753 5%
VerrettesArtibonite64 174 4%
Cap-
Haïtien
Nord50 648 3%
LéogâneOuest49 462 3%
Les CayesSud46 489 3%
BelladèreCentre41 548 3%
Aquin Sud37 233 3%
HincheCentre27 284 2%
Table 4. Top10hostmunicipalitiesforIDPs
AsinRound12,nearlyhalf(43%)ofIDPsareconcentratedinjusttenmunicipalities(outofthe140inthecountry),reflectingahighdensityofIDPsintheseareas(seeTable4andmap4below).
ThelistofthesetencommuneshasnotchangedsignificantlycomparedtoRound12(December2025),themaindifferencebeingthatthemunicipalityofBelladère(intheCentredepartment)
movedfrom5thto8thplaceamongthemunicipalitieshostingthemostIDPsduetothereturnsofseveralIDPswhohadbeenhostedthere(seepages18and23formoredetailsonthesituationin
theCentreandreturnmovements).
Asinpreviousassessments,themajorityofIDPscontinuetobehostedintheprovinces(79%versus21%intheMetropolitanAreaofPort-au-Prince,thecountry'scapital).Intheprovinces,nearlyall
IDPs(98%)stillresideoutsidesites–mainlywithhostfamiliesorinrentalhousing–whereasinthecapital,themajorityliveinspontaneoussites(69%).
Ofthe262spontaneoussitesidentifiedinthecountry,112(43%)areinthecapitaland150(57%)intheprovinces.However,thetotalnumberofIDPslivinginsitesremainshigherinthecapitaldue
toahigherpopulationdensityinthosesites.Thus,the112sitesinthecapitalhost213,168people,whilethe150sitesintheprovinceshost19,228.Onaverage,asiteinthecapitalshelters1,903
IDPs,comparedto128persiteintheprovinces.
9
Map 3. IDPsbydepartmentandpresenceofspontaneoussites Map 4. IDPsbymunicipalityandpresenceofspontaneoussites
Thesemapsareforillustrationpurposesonly.NamesandboundariesonthesemapsdonotimplyofficialendorsementoracceptancebyIOM
Displacement trends
Table 4. ChangeinthenumberofIDPsbetweenRounds12and13,byhostarea
BetweenRound12(December2025)andRound13(May2026),thetotalnumberofinternallydisplacedpersons(IDPs)sawaslightincreaseof1percent.Thisslightincreaseatthenationallevel,
however,maskssignificantregionaldynamics.
TheMetropolitanAreaofPort-au-Prince(MAPAP)recordedanincreaseof6percentcomparedtoRound12,exceedingforthefirsttimethethresholdof300,000IDPshosted.Thisincreaseis
mainlyexplainedbythearmedclashesthatoccurredinthecommuneofCitéSoleilinMarchandMay2026
2
.
TheArtibonitedepartmentalsosawitsnumberofIDPsincreaseby5percentcomparedtoRound12.Thisdepartmentcontinuedtobethemostaffectedbyseveralrecurrentarmedattacks,
forcingthousandsofpeopletoflee
3
.Theseare,forthemostpart,IDPsinsituationsofmultipledisplacement,whosevulnerabilitiesaretherebyincreased.Thisalsoexplainswhy,despitethe
repetitionofattacks,theoverallincreaseinthenumberofIDPsinthisdepartmentremainsrelativelymoderate.
OthersignificantincreaseswereobservedinmunicipalitiesoftheWestdepartmentoutsidethecapital,notablyinCabaret(+87%),whichisalsohostingIDPsfleeingArtibonite.
WhilesomeareasrecordedincreasesinthenumberofIDPs,othersexperiencedreturnmovements.Thenumberofformerlydisplacedpersonswhohavenowreturnedincreasedby89percent
comparedtoRound12,ormorethan78,000newreturnees,withremarkableincreasesinthecapital(+41%),inthemunicipalitiesoftheWestoutsidethecapital(+1,366%),aswellasinthe
Centredepartment(+125%).Thesereturnslargelyexplainthedecreaseinthenumberofinternallydisplacedpersons(IDPs)observedinseveralregions,notablyinCentre(-10%)andintheNorth
(-13%).Overall,withoutthesenewreturns,thenumberofIDPsinthecountrywouldhaveincreasedbyanadditional95,000peoplebetweenRounds12and13.
2.For more information, please refer to the following Emergency Tracking reports #85.1 and #93.1
3.For more information, please refer to the following Emergency Tracking reports #84, #87, 88.2, 90.1 et 92
Host regions # of IDPs in Round 12# of IDPs in Round 13% of variation# of sites in Round 12# of sites in Round 13
West
MAPAP 291,717 309,716 +6% 95 112
OutsideMAPAP 116,221 129,053 +11% 18 14
Great South
South 197,505 193,965 -2% 0 0
South-East 166,115 175,231 +5% 0 0
Grande'Anse 128,792 123,080 -4% 0 0
Nippes 70,637 72,753 +3% 0 0
Artibonite 150,279 158,358 +5% 44 65
Centre 162,374 146,739 -10% 67 66
Great North
North 134,991 117,032 -13% 4 4
North-West 20,233 20,862 +3% 0 0
North-East 11,390 20,073 +76% 1 1
TOTAL 1,450,254 1,466,862 +1% 229 262
10
113,582
155,166
127,977
194,624
313,901
362,551
578,074
702,973
1,041,229
1,287,593
1,412,199
1,450,254
1,466,862
Round 1
(September 2022)
Round 2
(November 2022)
Round 3 (March
2023)
Round 4 (June
2023)
Round 5
(December 2023)
Round 6 (March
2024)
Round 7 (June
2024)
Round 8
(September 2024)
Round 9
(December 2024)
Round 10 (June
2025)
Round 11
(September 2025)
Round 12
(December 2025)
Round 13 (May
2026)
2022 2023 2024 2025 2026
Graph 4. Evolutionofthedisplacementsituationbetween2022andMay 2026
845%increaseinthenumberofIDPsinnearlythreeyears(comparisonofthesituationbetweentheendof2022andMay2026)
1%increaseinthe
numberofIDPs
betweenend2025
andMay2026
11
102%increaseinthenumberofIDPsduring
theyear2023(comparisonofthesituation
betweentheendof2022andtheendof2023)
232%increaseinthenumberofIDPsduringtheyear2024
(comparisonofthesituationbetweentheendof2023and
theendof2024)
39%increaseinthenumberofIDPsin2025
Origins of internally displaced persons
Three-quartersofIDPs(75%)fledlocalitieslocatedintheWestdepartment,andmorespecifically
thecapital,theMAPAP,whichaloneaccountsfor53percentofIDPs'origin.Armedviolenceinthe
CentreandArtibonitedepartmentsalsomakesthesedepartmentssignificantareasoforiginfor
displacedpersons.
Differentiateddisplacementpatternsareobserveddependingonorigin:peoplefleeingtheWest,
andparticularlytheMAPAP,mainlyheadedtootherareasoftheWest(especiallywithinthecapital)
ortotheGreatSouthdepartments.Incontrast,thosedisplacedfromCentreandArtibonite
remainedinthosesamedepartmentsorheadednorthofthecountry.
Map 5. MunicipalitiesoforiginofIDPs
Graph 5. MunicipalitiesoforiginofIDPs
Graph 6. Departmentsoforigin(left)andhostdepartments(right)ofIDPs
12
Thismapisforillustrationpurposesonly.NamesandboundariesonthismapdonotimplyofficialendorsementoracceptancebyIOM
28%
16%
8%8%
5%
2%2%2%
4%
12%
<1%
7%
2%1%1%1%
Port-au-Prince
Gressier
Delmas
Carrefour
Croix-Des-
Bouquets Cité Soleil
Arcahaie
Cabaret
Other
Mirebalais
Other
Petite Rivière de
l'Artibonite
Saint-Marc
L'Estère
Dessalines
Other
West (75%) Centre (13%) Artibonite (12%)
Focuson the Metropolitan Area of Port-au-Prince
309,716
internally displaced persons
82,140
displaced households
increase in the number of IDPs,
compared to Round 12+6%
31%
of IDPs are in host
families/out of sites
69%
in sites
112
spontaneous sites
(+17 sites compared to
Round 12)
Municipality# of IDPs
% of IDPs
in the
MAPAP
% of variation
compared to
Round 12
Port-au-Prince160,17652% -1%
Delmas 83,05927% +11%
Pétion-Ville24,4118% +8%
Cité Soleil21,8617% +52%
Carrefour10,1593% +3%
Tabarre 7,477 2% +71%
Croix-Des-
Bouquets
2,573 1% -22%
TOTAL 309,716100% +6%
Neighborhood Municipality# of IDPs
% of IDPs in
the MAPAP
Bois Verna Port-au-Prince33,520 11%
Cite LouverturePort-au-Prince14,193 5%
Delmas 2 -Saint-Martin
-Tokyo
Port-au-Prince12,550 4%
Bourdon Port-au-Prince12,196 4%
Christ-Roi -LaluePort-au-Prince 9,375 3%
Bolosse Port-au-Prince 8,220 3%
Martissant -Breard -
Sainte-Bernadette
Port-au-Prince 7,849 3%
Kernizan -Defilee -
Charlemagne Peralte
Delmas 7,759 3%
Siloe Delmas 6,579 2%
Ti Bois Port-au-Prince 6,250 2%
Carte 6. DisplacementsituationintheneighborhoodsoftheMAPAP Table 5. IDPsbyhostmunicipalityintheMAPAP Table 6. Top10hostneighborhoodsforIDPsintheMAPAP
Graph 7. EvolutionofthenumberofIDPsintheMAPAPfrom2022toMay2026
IntheMAPAP,thenumberofIDPsincreasedby6percentcomparedtoRound12,exceedingforthefirsttimethethresholdof300,000people.Thisincreaseismainlyattributabletoarmedclashesthatoccurredin
themunicipalityofCitéSoleilinMarchandMay2026.SeveralmunicipalitiesofthecapitalthusrecordednotableincreasesinthenumberofIDPshosted,notablyTabarre(+71%),CitéSoleil(+52%),andDelmas
(+11%).Itshouldbenotedthat,alongsidethisincreaseinthenumberofIDPs,someneighborhoodsalsorecordedreturnmovements(seepage22).Withoutthesereturns,thenumberofIDPsintheMAPAPwould
haveincreasedby33,000people.ThemajorityofIDPsinthecapital(52%)continuetobehostedinthemunicipalityofPort-au-Prince,followedbyDelmas(27%).Nearly40percentofIDPsintheMAPAPare
concentratedinjusttenneighborhoods(outofthe429inthearea),illustratingahighdensityofdisplacedpopulationinsectorsthatstillofferarelativesenseofsecurity(seeTable6).Amongthesetenneighborhoods,
ninearelocatedinthemunicipalityofPort-au-PrinceandoneinDelmas.
IDPsinthecapitalstilllivepredominantlyinspontaneoussites(69%,or213,168people),makingtheMAPAPtheonlyareainthecountrywherethismodeofhostingremainspredominant.Itisalsoworthnotingthat
nearlyallIDPsintheZMPP(97%)hadfledfromotherneighborhoodswithinthesamearea,and3percentcamefromtheneighboringcommuneofKenscoff.
13
87,985
155,166
127,977
130,884139,853
160,550
184,789
173,156
261,448
296,936 293,410
291,717
309,716
R1 (Aug
2022)
R2 (Nov
2025)
R3 (March
2023)
R4 (Jun
2023)
R5 (Nov
2023)
R6 (March
2024)
R7 (Jun
2024)
R8 (Sept
2024)
R9 (Dec
2024)
R10 (Jun
2025)
R11 (Sept
2025)
R12 (Dec
2025)
R13 (May
2026)
This map is for illustration purposes only. Names and boundaries on this map do not imply official endorsement or acceptance by IOM.
Municipality# of IDPs
% of IDPs out of
sites
% of IDPs
in sites
# of sites
Port-au-Prince160,176 7% 93% 55
Delmas 83,059 58% 42% 23
Pétion-Ville 24,411 68% 32% 7
Cité Soleil21,861 23% 77% 18
Carrefour 10,159 85% 15% 3
Tabarre 7,477 52% 48% 5
Croix-Des-
Bouquets
2,573 81% 19% 1
TOTAL 309,716 31% 69% 112
Type of sites # of sites# of IDPs in sites
% of IDPs in
sites
School 37 80,932 38%
Covered and fenced area 24 42,559 20%
Uncovered and fenced area 20 40,004 19%
Church / Temple 21 37,853 18%
Uncovered and unfenced area 8 9,933 4%
Covered and unfenced area 2 1,887 1%
TOTAL 112 213,168 100%
Map 7. Types of sites in the MAPAP
Table 7. IDPsoutsidesites/withhostfamiliesvs.insites,byhostmunicipalityintheMAPAP
Table 8. IDPs by type of sites in the MAPAP
IntheMAPAP,asitehostsanaverageof1,903IDPs.ThedistributionofIDPsbetweensitesandoutsidesitesremainsstablecomparedtothepreviousround,with69percent
livinginsitesversus31percentoutside(comparedto68and32%duringRound12).
AmongIDPshostedinsitesinthecapital,38percentareinschools,nearly81,000peoplespreadacross37establishments(comparedtonearly77,000peoplein32schools
duringRound12).Toreducetheimpactoneducation,theEducation,Shelter,andCCCMclustershavedevelopedguidelinesaimedatbalancingthehostingandprotectionofIDPs
inschoolswiththecontinuationofeducationalactivities
4
.
4.For more information, please consult these guidelines (only available in French)
14
This map is for illustration purposes only. Names and boundaries on this map do not imply official endorsement or acceptance by IOM.
Focus on municipalities of the West (out of the
Metropolitan Area of Port-au-Prince)
129,053
internally displaced
persons
27,571
displaced households
increase in the number of IDPs,
compared to Round 12+11%
98%
of IDPs are in host
families/out of sites
2%
in sites
14
spontaneous sites
(-4 sites compared
Round 12)
Map 8. DisplacementsituationinthemunicipalitiesoftheWestoutsidetheMAPAP
Table9.IDPsbyhostmunicipalityinthemunicipalitiesoftheWestoutsidetheMAPAP
Graph 9. EvolutionofthenumberofIDPsinthemunicipalitiesofWestoutsidetheMAPAPbetweenJune2023andMay2026
5
Municipality # of IDPs % of IDPs
% of
variation
compared to
Round 12
Léogâne 49,462 38% +11%
Cabaret 26,895 21% +87%
Grand-Goâve 15,671 12% +2%
Arcahaie 14,036 11% -16%
Petit-Goâve 11,129 9% +2%
Pointe à Raquette 4,267 3% -19%
Anse à Galets 3,578 3% -19%
Cornillon/ Grand Bois 2,072 2% +11%
Kenscoff 1,943 1% -31%
Total 129,053 100% +11%
Graph8.MunicipalitiesoforiginofIDPslivingin
areasofWestoutsidetheMAPAP
5.BeforeRound4,theseDTMassessmentswerelimitedtotheMAPAP.However,atthebeginningof2023,DTMbegantoobservemassivepopulationdisplacementsfromthecapitaltoprovinces,whichledtoaprogressiveexpansionofthegeographicalcoverageoftheassessments.
StartingfromRound4(June2023),theywereextendedtotheentireWestdepartment,aswellastoCentreandArtibonite.InNovember2023(Round5),coveragewasextendedtothefourdepartmentsoftheGreatSouth.Finally,asofJune2024(Round7),theassessmentscoverthe
entirenationalterritory,includingtheNorth,North-East,andNorth-Westdepartments.
InthemunicipalitiesoftheWestdepartmentlocatedoutsidetheMAPAP,thenumberofIDPsincreasedby11percentbetweenRounds12and13,risingfrom116,221to129,053people.This
increaseismainlyexplainedbythehostingofpeoplefleeingtheArtibonitedepartment,particularlyinthemunicipalityofCabaret,whichrecordedan87percentincreaseinthenumberofIDPs
hosted.Nevertheless,LéogâneremainsthemainmunicipalityhostingIDPsinthispartoftheWest,concentrating38percentofIDPs,followedbyCabaret(21%).ThevastmajorityofIDPs(98%)
liveoutsideofsites,while2percentresidein14sitesspreadacrossLéogâne,Arcahaie,Cabaret,andKenscoff.Furthermore,nearlyallIDPshostedinthemunicipalitiesoftheWestoutsidethe
MAPAPcomefromlocalitieswithinthesamedepartment(99%).ThemunicipalityofGressierremainsthemainplaceoforigin(46%),anditisalsothesecondmunicipalityoforiginforIDPsatthe
nationallevel(seepage12).
15
46%
21%
18%
6%
5%
3%
1%
Gressier
Cabaret
Arcahaie
Léogâne
Kenscoff
Other
Mirebalais
West (99%)
Centre
(1%)
This map is for illustration purposes only. Names and boundaries on this map do not imply official endorsement or acceptance by IOM.
10,127 6,168
30,929 24,697
68,411
144,152
115,935
100,020
116,221
129,053
R4 (Jun 2023)R5 (Nov 2023)R6 (March 2024)R7 (Jun 2024)R8 (Sept 2024)R9 (Dec 2024)R10 (Jun 2025)R11 (Sept 2025)R12 (Dec 2025)R13 (May 2026)
Focus on the four departments of the Great South
565,029
internally displaced persons
130,397
displaced households
increase in the number of IDPs,
compared to Round 12+0,4%
100%
of IDPs are in host
families/out of sites
0
spontaneous site
(same as in
Round 12)
MunicipalityDepartment
Displaced
households
# of IDPs
% of IDPs
in the
Great
South
Jacmel South-East16,60471,75313%
Les Cayes South12,45046,4898%
Aquin South 6,95637,2337%
JérémieGrande'Anse5,53523,8094%
La ValléeSouth-East4,41819,6113%
Torbeck South 5,40119,5203%
AbricotsGrande'Anse4,25019,0203%
Cavaillon South 3,65318,2783%
Bainet South-East3,80716,3073%
Saint louis du SudSouth 3,38115,8793%
Map 9. DisplacementsituationintheGreatSouth Table10.Top1OhostmunicipalitiesforIDPsintheGreatSouth
Graph10.MunicipalitiesoforiginofIDPshostedintheGreatSouth
Graph11.EvolutionofthenumberofIDPsintheGreatSouthbetween
theendof2023andMay2026IntheGreatSouth,thenumberofIDPschangedverylittlebetweenRounds12and13,with
anincreaseofonly0.4percent.SinceRound11(September2025),thisrelativestagnation
hasbeenobservedcontinuously.Itcanbeexplainedbythegrowingdifficultiesinleavingthe
capital–themainoriginofIDPshostedintheGreatSouth–duetoinsecurityand
roadblocks.Indeed,68percentofIDPsintheGrandSudcomefromtheMAPAP.Gressieris
theonlymunicipalityofmajororiginlocatedoutsidethecapital,representing32percentof
IDPs.
HalfofIDPsintheGreatSouthareconcentratedinjust10municipalitiesoutofthe51inthe
region,reflectingastrongconcentrationofdisplacedpopulationsinspecificareas,mainly
urban.ThemunicipalitiesofJacmelandLesCayestogetherhost21percentofallIDPsinthe
GreatSouth.
16
34%
32%
16%
9%
8%
1%
1%
0.2%
Port-au-Prince
Gressier
Carrefour
Delmas
Croix-Des-
Bouquets
Cité Soleil
Kenscoff
Tabarre
West (100%)
116,422
116,422
268,452
315,200
398,016
497,768
553,023
563,049
565,029
R5 (Nov
2023)
R6 (March
2024)
R7 (Jun
2024)
R8 (Sept
2024)
R9 (Dec
2024)
R10 (Jun
2025)
R11 (Sept
2025)
R12 (Dec
2025)
R13 (May
2026)
This map is for illustration purposes only. Names and boundaries on this map do not imply official endorsement or acceptance by IOM.
Focus on the department of Artibonite
158,358
internally displaced persons
34,090
displaced households
increase in the number of IDPs,
compared to Round 12+5%
95%
of IDPs are in host
families/out of sites
5%
in sites
65
spontaneous sites
(+21 sites compared
to Round 12)
Map 10. DisplacementsituationinArtibonite Table11.IDPsbymunicipalityinArtibonite
Graph 13. EvolutionofthenumberofIDPsinArtibonitebetween
June2023andMay2026
Municipality # of IDPs
% of IDPs in
Artibonite
% of variation
compared to
Round 12
Verrettes 64,174 41% -5%
Saint-Marc 21,316 13% +18%
Gonaïves 15,322 10% +11%
Saint-Michel de l'Attalaye13,634 9% +9%
Dessalines 11,338 7% +32%
Gros Morne 8,178 5% -7%
Anse Rouge 6,894 4% +40%
Petite Rivière de l'Artibonite4,363 3% +100%
Ennery 3,998 3% -8%
La Chapelle 2,305 1% +9%
L'Estère 2,289 1% +18%
Terre Neuve 1,805 1% +3%
Marmelade 1,311 1% +0,1%
Grande Saline 1,040 1% -9%
Desdunes 391 0.2% -64%
Total 158,358100% +5%
Graph 12. MunicipalitiesoforiginofIDPshostedinArtibonite
TheArtibonitedepartmentcontinuedtobeaffectedbynumerousarmedattacks,forcingthousandsof
peopletoflee
6
.MostofthemareIDPsforcedtomoverepeatedly,whichfurtherincreasestheir
vulnerability.Thisisalsowhy,despitetherepetitionofviolence,thetotalnumberofIDPsdidnot
experienceamassiveincreaseinthisdepartment(from150,279inRound12to158,358currently,an
increaseof+5%).
ThemainhostmunicipalitiesremainVerrettes(41%ofIDPsinArtibonitearehostedthere),Saint-Marc
(13%),andGonaïves(10%).ThemajorityofIDPs(95%)continuetoliveoutsidesites,mainlywithhost
families.Itshouldbenoted,however,thatthenumberofsiteshasincreasedsignificantly,from44to65
betweenRounds12and13.
6. For more information, please refer to the following Emergency Tracking reports #84, #87, 88.2, 90.1 et 92
17
This map is for illustration purposes only. Names and boundaries on this map do not imply official endorsement or acceptance by IOM.
47%
14%
11%
8%
3%
1%
1%
1%
10%
3%
1%
Petite Rivière de l'Artibonite
Saint-Marc
L'Estère
Dessalines
La Chapelle
Verrettes
Gros Morne
Grande Saline
Port-au-Prince
Croix-Des-Bouquets
Delmas
Artibonite (86%)
West (14%)
22,440
27,430
27,430
34,952
44,566
84,719
92,304
121,896
150,279
158,358
R4 (Jun 2023)R5 (Nov 2023)R6 (March
2024)
R7 (Jun 2024)R8 (Sept 2024)R9 (Dec 2024)R10 (Jun 2025)R11 (Sept
2025)
R12 (Dec
2025)
R13 (May
2026)
Graph 15. EvolutionofthenumberofIDPsinCentrebetweenJune2023andMay2026
Focus on the department of Centre
146,739
internally displaced persons
35,627
displaced households
decrease in the number of IDPs,
compared to Round 12-10%
95%
of IDPs are in host
families/out of sites
5%
in sites
66
spontaneous sites
(-1 site compared
to Round 12)
Map 11. DisplacementsituationinCentre Table 12. IDPsbyhostmunicipalityinCentre
Graph 14. MunicipalitiesoforiginofIDPshostedin
Centre
ThedownwardtrendinthenumberofIDPsintheCentredepartmentcontinuedduringthisround.ThenumberofIDPshostedinthisdepartmentfellfromnearly200,000inRound11(September
2025)to146,739currently,adecreaseof26percent.BetweenRounds12and13,thedecreasewas11percent.ThemunicipalityofBelladèrerecordedthelargestdecrease(-32%),althoughit
remainsthemainhostmunicipalityinthedepartment,concentrating28percentofIDPs,followedbyHinche(19%)andBoucanCarré(16%).Thisdecreaseismainlyexplainedbysignificantreturn
movementsobservedintheCentre,wherethenumberofformerlydisplacedpersonsnowreturned,increasedby125percent(seepage21formoredetails).
ItisworthnotingthatsomemunicipalitiesexperiencednotableincreasesinthenumberofIDPs,particularlyMirebalais.Followingarmedattacksthatoccurredintheneighboringmunicipalityof
BoucanCarréinMarch2026,severalpeoplefoundrefugeinthe2ndcommunalsectionofSarazininMirebalais
7
.Despitethis,themunicipalityofMirebalaisremainsthemainareaoforiginforIDPs
hostedintheCentredepartment(85%).
Municipality # of IDPs
% of IDPs in
Centre
% of variation
compared to
Round 12
Belladère 41,548 28% -32%
Hinche 27,284 19% -8%
Boucan Carré 24,201 16% +0,2%
Mirebalais 14,742 10% +354%
Lascahobas 10,784 7% +22%
Thomassique 9,027 6% +2%
Thomonde 6,714 5% +10%
Maïssade 4,589 3% +2%
Cerca Carvajal 2,850 2% -67%
Savanette 2,215 2% -56%
Saut d'Eau 2,094 1% +60%
Cerca La Source 691 1% -0,1%
Total 146,739 100% -10%
18
85%
12%
2%
1%
Mirebalais
Lascahobas
Saut d'Eau
Boucan Carré
Centre (100%)
7. For more information, please refer to the following Emergency Tracking report #86.1
This map is for illustration purposes only. Names and boundaries on this map do not imply official
endorsement or acceptance by IOM.
28,975 22,935 22,935
40,753
52,045
67,608
147,230 199,258
162,374
146,739
R4 (Jun 2023)R5 (Nov 2023)R6 (March 2024)R7 (Jun 2024)R8 (Sept 2024)R9 (Dec 2024)R10 (Jun 2025)R11 (Sept 2025)R12 (Dec 2025)R13 (May 2026)
Focus on the three departments of the Great North
157,967
internally displaced persons
36,109
displaced households
decrease in the number of IDPs,
compared to Round 12-5%
99.6%
of IDPs are in host
families/out of sites
0.4%
in sites
5
spontaneous sites
Map 12. DisplacementsituationintheGreatNorth
Graph 17. EvolutionofthenumberofIDPsintheGreat
NorthbetweenJune2024andMay2026
Graph16.MunicipalitiesoforiginofIDPshostedintheGreatNorth
IntheGreathNorth,thenumberofIDPsdecreasedby5percentbetweenRounds12and13,fallingfrom166,614to157,967.This
decreaseismainlyexplainedbyreturnmovementsofseveralIDPstotheCentredepartment.
Nearlythree-quartersofIDPsintheGreathNorth(73%)areconcentratedinjusttenmunicipalities(outofthe42intheregion),reflectinga
highconcentrationofdisplacedpopulationsinspecificareas(seeTable13above).Amongthesetenmunicipalities,sevenarelocatedinthe
Northdepartment,twointheNorth-East,andoneintheNorth-West.ThemunicipalityofCap-Haïtienremainsthemainhostmunicipality,
with32percentofIDPsintheregion.
TheGreatNorthcontinuestostandoutforhavingthegreatestdiversityofIDPoriginsatthenationallevel:49percentofthemfledthe
Westdepartment(mainlythemunicipalityofPort-au-Prince),30percentarefromtheCentredepartment(morepreciselyfromMirebalais),
and21percentcomefromArtibonite(mainlyfromthemunicipalityofPetiteRivière).
Municipality Department
Displaced
households
# of IDPs
% of IDPs
in the
Great
North
Cap-Haïtien North 12,66250,64832%
Plaisance North 2,37811,8908%
Limonade North 1,7808,830 6%
Ouanaminthe North-East 2,1008,415 5%
Limbé North 1,6668,330 5%
Pilate North 1,2996,498 4%
Jean Rabel North-West 1,2146,046 4%
Quartier Morin North 1,0365,180 3%
Borgne North 894 4,735 3%
Saint-Louis du
Nord
North-West 1,1114,143 3%
Table 13. Top10hostmunicipalitiesforIDPsintheGreatNorth
19
(Same as on
Round 12)
This map is for illustration purposes only. Names and boundaries on this map do not imply official endorsement or
acceptance by IOM.
21%
10%
6%
6%
2%
2%
1%
1%
30%
18%
1%
1%
1%
Port-au-Prince
Croix-Des-Bouquets
Carrefour
Delmas
Arcahaie
Kenscoff
Tabarre
Other
Mirebalais
Petite Rivière de l'Artibonite
Desdunes
L'Estère
Gros Morne
West (49%)
Centr
e
(30%)
Artibonite (21%)
22,841
93,053
84,047
137,075144,592
166,614
157,967
R7 (Jun
2024)
R8 (Sept
2024)
R9 (Dec
2024)
R10 (Jun
2025)
R11 (Sept
2025)
R12 (Dec
2025)
R13 (May
2026)
ANALYSES ABOUT RETURNEES -FORMERLY INTERNALLY DISPLACED
PsychosocialsupportactivityinasitehostingIDPsinthe
capital© IOM Haiti, May 2026
165,937
returned persons
35,631
returned households
+89%
increase in the number of
returnees, compared to
Round 12
MunicipalityDepartment
# of
returned
individuals
% of
returned
individuals
% of variation
compared to
Round 12
LascahobasCentre34,80021% +135%
Port-au-
Prince
Ouest 29,24318% +75%
CabaretOuest 15,607 9% +100%
Delmas Ouest 14,482 9% +106%
ArcahaieOuest 11,500 7% +100%
Léogâne Ouest 11,200 7% +100%
Tiburon Sud 8,207 5% -16%
MirebalaisCentre 5,950 4% +116%
Dame
Marie
Grande'Anse4,590 3% +100%
Les AnglaisSud 4,205 3% +10%
Map12.ReturnareasforreturneesformerlyIDPs Table14.Returneesbyreturnarea Table15.Top10municipalitiesofreturn
21Return areas of returnees
55%
are females
(adults et minors)
45%
are children
Areas of return
# of
returned
individuals
% of
returned
individuals
% of
variation
compared to
Round 12
West
(57%)
MAPAP 50,92031% +41%
Outside
MAPAP
42,81226% +1 366%
Great
South
(11%)
South 12,4127% -13%
South-East0 0% 0%
Grande'Anse6,340 4% +100%
Nippes 0 0% 0%
Artibonite (6%)9,488 6% -27%
Centre (25%)41,28025% +125%
Great
North (1%)
North 380 0.2% -3%
North-
West
2,305 1% -7%
North-
East
0 0% 0%
TOTAL165,937100% +89%
Thenumberofreturnees(formerlyinternallydisplacedpersons)increasedsignificantlybetweenRounds12and13,risingfrom87,600to165,937,anincreaseof89percent.Significantincreaseswere
observedinthemunicipalitiesoftheWestlocatedoutsidetheMAPAP(+1,366%),notablyinKenscoff(wherethenumberofreturneesrosefrom1,263to3,620,anincreaseof+187%),inCabaret
(from0to15,607people,anincreaseof+100%),inArcahaie(from0to11,500,anincreaseof+100%),andinLéogâne(from0to11,200,anincreaseof+100%).Otherareasthatrecordednotable
increasesaretheCentredepartment(+125%)andthecapital(+41%)–seethefollowingtwopagesformoredetailsonthesetwoareas.Itisalsoworthnotingthat84percentofreturneesare
concentratedinjusttenmunicipalities(seeTable15above).Itwouldbeprematuretoassertthatthesereturnsaresustainable.ReturnedhouseholdsthatparticipatedininterviewsintheMAPAPcited
variousfactorsessentialforanchoringtheirreturnsustainably(seenextpage).
Furthermore,itshouldbenotedthatintheWest,Centre,andArtibonitedepartments,thereturneeshadmostlylefttheirhomesduetoinsecurityandtheresultingarmedviolence.Incontrast,inthe
GreatSouth,theyaremostlypeoplewhotemporarilyfledtheirareafollowingdisastersbeforereturning.
This map is for illustration purposes only. Names and boundaries on this map do not imply official endorsement or acceptance by IOM.
50,920
returned persons
11,765
returned households
+41%
increase in the number of
returnees, compared to
Round 12
Map13.NeighborhoodsofreturnofreturneesintheMAPAP Table16.MunicipalitiesofreturnintheMAPAP
22Focus sur la Metropolitan Area of Port-au-Prince
Municipality
# of
returned
individuals
% of
returned
individuals in
the MAPAP
% of variation
compared to
Round 12
Port-au-Prince29243 57% +75%
Delmas 14482 29% +106%
Croix-Des-Bouquets2545 5% -56%
Pétion-Ville 2046 4% +243%
Cité Soleil1702 3% -62%
Tabarre 785 2% -40%
Carrefour 117 0.20% -23%
TOTAL 50 920100% +41%
Table17.Top10returnneighborhoodsintheMAPAP
NeighborhoodMunicipality
# of
returned
individuals
% of
returned
individuals in
the MAPAP
Christ-Roi Delmas 5,200 10%
Ti Savanne -TrantinPort-au-Prince3,547 7%
Croix Desprez -Ti-
Source
Port-au-Prince3,275 6%
BaillergeauPort-au-Prince3,135 6%
Revine PintadePort-au-Prince3,000 6%
Tapis RougePort-au-Prince2,761 5%
Campèche Port-au-Prince2,583 5%
Pacot Port-au-Prince2,451 5%
Bas MartissantPort-au-Prince2,024 4%
Sicot Port-au-Prince1,921 4%
Whileseveralareasofthecapitalcontinuetobeaffectedbyarmedattacks,particularlythemunicipalityofCitéSoleil,someothersthathaveexperiencedarelativelullhaverecordedsignificant
returnmovements.ThisisespeciallythecaseforthemunicipalitiesofPort-au-PrinceandDelmas,wherethenumberofreturneesincreasedfrom16,664inRound12to29,243inRound13
(+75%),andfrom7,016to14,482(+106%),respectively.Indeed,aroundAugust2025,armedgroupswithdrewfromseveralneighborhoodsborderingthesetwomunicipalities(theBasDelmasand
HautPort-au-Princeareas)
8
,whichledtothesereturnmovements.
AstudyconductedbyDTMintheseareasindicatedthatthemajorityofresidentshavenotyetreturned,andthosewhohavecomeback–althoughtheyintendtostay–mentionedthatseveral
factorsarestillnecessaryfortheirreturntobesustainable,includingthepresenceofgovernmentsecurityforces,shelterrehabilitation,accesstolivelihoods,water,andhealthservices.Itisworth
notingthatseveralcommunityinfrastructuresintheseareashavesuffereddamage,particularlyhealthfacilitiesandschools
9
.
Furthermore,itisimportanttohighlightaconcentrationofreturneesinspecificneighborhoods.Outofthe429neighborhoodsinthecapital,nearlythree-quarters(74%)ofreturneesare
concentratedinjust17neighborhoods(seeMap13andTable17ofthetop10returnneighborhoods).
8. For more details, please refer to this ICG article
9. IOM, April 2026, A study on the return dynamics of internally displaced persons in the neighbourhoodsof Bas Delmas and Haut Port-au-Prince, IOM Haiti.
This map is for illustration purposes only. Names and boundaries on this map do not imply official endorsement or
acceptance by IOM.
41,280
returned persons
8,205
returned households
+125%
increase in the number of
returnees, compared to Round 12
Map14.ReturnareasintheCentre Table18.MunicipalitiesofreturnintheCentre
23Focus on the department of Centre
MorethaneightoutoftenreturneesintheCentreresideinthemunicipalityofLascahobas(84%).Thenumberofreturneesinthismunicipalityincreasedby135percent,risingfrom14,800in
Round12to34,800currently.Indeed,inJuly2025,severalpeoplehadbeguntoleavethismunicipalitytotakerefugemainlyintheneighboringmunicipalityofBelladère,followingthreatsof
armedattacksbyarmedgroups.
10
Followingarelativelullinthesecuritysituationinthearea,significantreturnmovementsbegantobeobservedduringRound12andcontinuedtobeobserved
duringthisround.Thus,asmentionedearlier,thenumberofIDPshostedinBelladèrehassignificantlydecreasedasaresult.
ThemunicipalityofMirebalaisisthesecondmunicipalityofreturn,followedbySautd'Eau(seeTable18).ThesethreemunicipalitiesaretheonlyonesinthedepartmentofCentrewhere
returneesarepresent,giventhattheyarealsothosethathavemostsufferedfromarmedattacksorthreatsofattacks.
Municipality
# of returned
individuals
% of returned
individuals in
Centre
% of variation
compared to
Round 12
Lascahobas 34,800 84% +135%
Mirebalais 5,950 14% +116%
Saut d'Eau 530 1% -35%
Thomassique 0 0% 0%
Cerca Carvajal 0 0% 0%
Boucan Carré 0 0% 0%
Cerca La Source 0 0% 0%
Savanette 0 0% 0%
Hinche 0 0% 0%
Thomonde 0 0% 0%
Belladère 0 0% 0%
Maïssade 0 0% 0%
Total 41,280 100% +125%
10. For more information, please refer to the following Emergency Tracking report #66.1
This map is for illustration purposes only. Names and boundaries on this map do not imply official endorsement or
acceptance by IOM.
PRIORITY NEEDS
Medicalassistancetoaninternallydisplacedpersoninthe
capital© IOM Haiti, May 2026
Priority needs
25
Graph18.PriorityneedsreportedinIDPand/orreturneehostlocations(%of
hostlocalities)(Multiplechoicequestion)
DuringassessmentroundsoftheDisplacementTrackingMatrix(DTM),key
questionsonvarioushumanitariansectorsareaskedtoinformsectoraland
intersectoralprioritizationofareas.Adedicatedreportonthesesectoral
analyseswillbepublishedseparately.Furthermore,keyinformantsareasked
toindicatethethreepriorityneedsinareashostingIDPsand/orreturnees.
Duringthisround,1,197localitieswereassessed,ofwhich1,075were
identifiedashostingatleastoneofthesetwopopulationgroups.
Duringthisround,themostfrequentlymentionedneedwasfood(in73%of
localities),followedmainlybyaccesstolivelihoods(65%),shelter(38%),water,
hygieneandsanitation(38%),andhealth(37%).Thishierarchyhasnot
changedsignificantlyforseveralrounds.
73%
65%
38% 38% 37%
24%
10% 9%
Food Livelihoods ShelterWater, Hygiene
and Sanitation
Health Education ProtectionNon-food items
35%
19% 16% 13%
6% 4% 3% 2% 2%
Members of
community
associations
Person
exercising a key
profession
(Teacher,
Doctor, Nurse,
etc.)
Representatives
of IDPs or
returnees
Members of
ASEC or
CASEC
Civil protection
focal points
Religious leadersOther NGO staffMunicipalities
SinceAugust2022,thenationalCivilProtectionDirectorate(DirectionGénéraledelaProtection
Civile-DGPC)andIOM'sDisplacementTrackingMatrix(DTM)havebeenconductingperiodic
assessmentsofsiteshostingdisplacedpopulations.Theseassessmentsaimtoprovidekey
informationonthedisplacementsituation,aswellasonthelivingconditionsandneedsofdisplaced
persons.Theobjectiveistoinformresponsestrategies,whetherforhumanitarianinterventionsor
programsaimedatdurablesolutions.
Dataiscollectedthroughdirectobservationsandgroupinterviewsconductedwithkeyinformants
atthesmallestmappedgeographiclevelinthecountry,namelyneighborhoodsintheMAPAP(the
capital)andcommunalsectionsoutsidetheMAPAP.Spontaneoussitesarealsoassessedwhere
theyexist.Onaverage,fourkeyinformantswereinterviewedperassessedlocality.
DatacollectionforRound13wascarriedoutfrom14March14to17May2026,by543
enumerators(including62%menand38%women)whoconductedinterviewswith4,642key
informants(70%menand30%women)inthe1,197assessedlocalities,distributedasfollows:516
communalsectionsoutsidetheMAPAP,419neighborhoodsintheMAPAP,and262spontaneous
sites.Duetosecurityconstraints,interviewswithkeyinformantswereconductedremotelyinnine
percentoflocalities,whiletheywereconductedinthefieldfortheremaining91percent(see
Map15).
DatacollectionwascarriedoutbyIOMandDGPCteams,withtheactiveparticipationofstaff
fromtheNationalOfficeofMigration(ONM),theHaitianInstituteofStatisticsandInformatics
(IHSI),andtheHousingandPublicBuildingConstructionUnit(UCLBP).
Limits:
Theinformationcollectedisbasedonestimatesprovidedbykeyinformantsregardingtheirown
community.Toobtainthemostreliableestimatespossible–thatis,thoseclosesttoreality–
assessmentsareconductedatthelowestgeographiclevel,andthekeyinformantsinterviewedare
thosewiththebestknowledgeoftheirlocality(seeGraph19).
1,197
assessed localities
4,642
key informants interviewed
(91% assessed through field
interviews and 9% by phone)
Map15.LocalitiesassessedinthefieldduringRound13
ANNEX 1. METHODOLOGY
26
This map is for illustration purposes only. Names and boundaries on this map do not imply official endorsement or acceptance by IOM.
Graph 19. ProfilesofkeyinformantsinterviewedduringRound13