
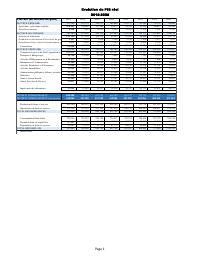
Real GDP by branch of activity, 2018-2025
- Records real GDP falling across every sector between 2018 and 2025: the primary sector from 115,348 to 95,585 million gourdes, the secondary from 169,500 to 119,171 and the tertiary from 336,383 to a 2025 level below its 2018 starting point.
- Shows the secondary sector taking the deepest cut, with manufacturing falling from 112,169 to 88,468 million gourdes and construction from 45,864 to about 25,631, roughly halving over seven years.
- Records electricity, gas, steam and air conditioning production and distribution collapsing from 5,997 to 2,204 million gourdes, a fall of about 63 percent, which is the sharpest decline of any branch.
- Shows public administration and defence rising against the trend, from 31,546 to about 35,800 million gourdes, so the state's own value added grew while production fell.
- Records education at 27,934 rising to about 31,325 and health and social action from 22,390 to about 26,573 million gourdes, both increasing while the productive sectors contracted.
- Puts wholesale and retail trade, the largest single tertiary branch, at 141,911 million gourdes in 2018 falling to about 119,541, and transport and storage from 16,756 to about 8,263, roughly halving.
One-page MEF table of Haiti's real GDP in millions of gourdes from 2018 to 2025, broken down by branch of activity within the primary, secondary and tertiary sectors, with net taxes on subsidies, non-agricultural GDP, and a resources-and-uses block covering imports, final consumption and gross fixed capital formation. The table records an unbroken contraction across the eight years: GDP falls from 658,286 million gourdes in 2018 to 552,507 million in 2025, and non-agricultural GDP from 549,836 to 471,921. Every broad sector shrinks, the primary sector from 115,348 to 85,880 and the secondary from 169,500 to 108,199, with construction down from 45,864 to 20,660 and electricity and gas from 5,997 to 1,995. Wholesale and retail trade, the largest tertiary branch, falls from 141,911 to 93,062, and transport and storage from 16,756 to 5,260. Three branches grow against the trend: information and communication, financial and insurance activities, and public administration and defense, the last rising from 31,546 to 43,418. The sharpest movement is in gross fixed capital formation, which drops from 112,801 in 2018 to 27,821 in 2025, about a quarter of its starting level.
Full Document Text
Extracted text from the original document for search indexing.
How to cite
Ministry of Economy and Finance (MEF), 2026, Real GDP by branch of activity, 2018-2025, https://www.mef.gouv.ht/