Extracted text from the original document for search indexing.
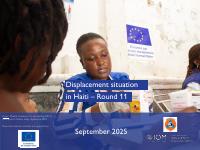
Displacement situation
in Haiti – Round 11
Cover: Medical assistance in a site hosting IDPs in
the capital © Molière Adely, Septembre 2025
These data collection activities are supported by:
September 2025
�CONTENT
KEY RESULTS ........................................................................................................................................................................................................................................................................... 3
INTERNALLY DISPLACED PERSONS
DISAGGREGATION BY AGE AND GENDER..................................................................................................................................................................... 5
IDPs’ HOST LOCATIONS.................................................................................................................................................................................................................... 6
EVOLUTION OF THE DISPLACEMENT SITUATION BETWEEN 2022 AND 2025 .......................................................................... 8
CHANGES BETWEEN ROUNDS 10 AND 11.................................................................................................................................................................... 9
ORIGINS OF IDPs........................................................................................................................................................................................................................................11
REASONS AND PERIODS OF DISPLACEMENT............................................................................................................................................................. 13
PRIORITY NEEDS...................................................................................................................................................................................................................................... 14
FOCUS ON THE METROPOLITAN AREA OF PORT-AU-PRINCE (MAPAP).......................................................................................... 15
FOCUS ON MUNICIPALITIES OF THE WEST OUTSIDE THE MAPAP ..................................................................................................... 19
FOCUS ON THE GREAT SOUTH REGION ..................................................................................................................................................................... 20
FOCUS ON THE CENTRE REGION .......................................................................................................................................................................................... 21
FOCUS ON THE ARTIBONITE REGION............................................................................................................................................................................... 23
FOCUS ON THE GREAT NORTH REGION..................................................................................................................................................................... 24
RETURNED PERSONS (FORMER IDPs)............................................................................................................................................................................................................. 25
METHODOLOGY ................................................................................................................................................................................................................................................................. 26
�HAITI – MOBILITY TRACKING
Displacement situation in Haiti – September 2025
Data collection:
1 August – 20 September 2025
Publication: October 2025
KEY RESULTS
1,412,199
Internally Displaced Persons
(12% of the Haitian population)
85%
of IDPs in host
families / out of
sites
15%
in sites
324,785
Displaced hoseholds
238
sites
(-8 compared to
Round 10)
+10%
Increase in the
number of IDPs
compared to
Round 10
54%
of IDPs are women
(adults and minors)
53%
of IDPs are children
97 in the Metropolitan Area of Port-au-Prince (MAPAP) (same as in Round 10)
141 in provinces (-8 compared to Round 10)
Figure 1. Internally Displaced Persons by Department
INTERNATIONAL ORGANIZATION FOR MIGRATIONS
Website: https://dtm.iom.int/haiti
Contact: dtmhaiti@iom.int
3
This map is for illustration purposes only. Names and boundaries on this map do not imply official
endorsement or acceptance by IOM.
�HAITI – MOBILITY TRACKING
Displacement situation in Haiti – September 2025
Data collection:
1 August – 20 September 2025
Publication: October 2025
KEY RESULTS
1. This new exercise (Round 11) of the Displacement Tracking Matrix indicates a presence of 1,412,199 Internally Displaced Persons (IDPs) in Haiti, a 10
per cent increase compared to the previous exercise (Round 10 – June 2025). The main reasons for this increase are the continued deterioration of the
security situation in the Artibonite and Centre departments. IDPs in Haiti now represent 12 per cent of the Haitian population1.
2. The Centre and Artibonite departments have experienced the largest increases in the number of IDPs hosted there. The number of IDPs in the Centre
department increased from 147,230 in Round 10 to 199,258 (+35%), following preventive displacements driven by attacks in localities bordering the
municipalities of Mirebalais and Lascahobas in July 2025. In the Artibonite region, the number of IDPs increased from 92,304 to 121,896 (+32%), following
several armed attacks in this department between July and September 2025, particularly in the municipalities of La Chapelle, Dessalines, Verrettes, and Petite
Rivière.
3. The trend toward a greater increase in the number of IDPs in provinces than in the capital continued to be observed during this round. The majority of
IDPs are hosted in provinces,1 with 79 per cent hosted in provinces compared to 21 per cent in the Metropolitan Area of Port-au-Prince (MAPAP). This
proportion has increased slightly compared to Round 10 (77% of IDPs were hosted in provinces). Unlike in previous years, in 2025, the majority of armed
attacks resulting in mass displacements took place in the provinces: of all displacements observed so far in 2025 by the DTM's emergency tracking tool, only
31 per cent were due to attacks in the capital, compared to 69 per cent in provinces, particularly in the Centre (38% of mass displacements observed in
2025) and Artibonite (26%)3. In 2024, 76 per cent of the total mass displacement observed was due to attacks in the capital, compared to 24 per cent in
provinces. In 2023, these proportions were 68 per cent in the capital compared to 32 in provinces. This demonstrates a growing deterioration of the
security situation beyond the capital in 2025, mainly in the Artibonite and Centre departments.
4. The number of sites decreased slightly, from 246 to 238 sites, and the number of IDPs hosted in sites also decreased, from 215,146 to 211,841 (-2%).
This decrease is mainly due to relocation programs implemented in certain sites in the capital by government institutions to enable IDPs to leave these sites.
Although the number of sites in provinces remains higher than in the capital (141 vs 97), the number of IDPs residing in sites remains higher in the capital
than in provinces, as sites in the capital are more densely populated. On average, a site in the capital hosts 1,992 people compared to 132 in provinces.
5. The majority of IDPs are still hosted outside sites/in host families (85% vs 15% in sites), putting ever-increasing pressure on the already limited resources
of host communities. The capital remains the only area where the majority of IDPs are in sites (66% vs 34% outside sites), while 98 per cent of IDPs hosted
in provinces are outside sites, and 2 per cent are in sites.
6. The main needs reported by key informants in locations hosting IDPs remain the same as in Round 10, in order of priority: food, access to livelihoods,
water, hygiene and sanitation (WASH), shelter, and health.
1.
2.
3.
For Haitian population figures, see UNFPA estimates, 2024
The term "province" refers to all areas of the country outside the MAPAP, the country's capital. The MAPAP consists of the municipalities of Port-au-Prince, Delmas, Cité Soleil, Pétion-Ville, Carrefour, Tabarre,
and Croix-des-Bouquets
For more information, see the emergency tracking dataset.
�HAITI – MOBILITY TRACKING
Displacement situation in Haiti – September 2025
Figure 3. IDPs’ age and sex disaggregation for IDPs in sites only
IDPs’ AGE AND SEX DISAGGREGATION
60+
Figure 2. IDPs’ age and sex disaggregation
60+
4%
21%
18%
11%
9%
6 - 11
6 - 11
8%
7%
1-5
<1
Women
(54%)
6%
4%
5%
30%
12 - 17
12 - 17
1-5
5% 4%
4%
18 - 59
18 - 59
Data collection:
1 August – 20 September 2025
Publication: October 2025
Men
(46%)
27%
8%
Women
(52%)
Men
(48%)
5% 5%
3%3%
<1
1%
1%
Figure 4. IDPs’ age and sex disaggregation for IDPs OUT of sites/in host families
3%
60+
More than half of IDPs (54%) are women (adults and minors), and 53% are children. It
is worth noting a significant difference in the demographic structure of IDPs depending
on their host locations. Within sites, the majority of IDPs are adults (66% vs 34% of
children), while outside sites, children constitute the majority (55% vs 45% of adults).
Indeed, given the dire living conditions in sites, many IDPs often separate from their
children, preferring to send them to relatives, particularly from the capital to provinces.
18 - 59
4% 4%
21%
16%
12 - 17
11%
9%
6 - 11
9%
7%
7%
5%
1-5
<1
INTERNATIONAL ORGANIZATION
FOR MIGRATIONS
ORGANISATION
INTERNATIONALE POUR LES MIGRATIONS
Website: https://dtm.iom.int/haiti
Site web: https://dtm.iom.int/haiti
Contact: dtmhaiti@iom.int
Contact: dtmhaiti@iom.int
8%
Women
(56%)
Men
(44%)
4% 3%
The following citation is required when using the data and information included in this report: “International Organization for
Migration5(IOM), Round 9 - December 2024, DTM Assessment of
theto rounding,
displacementsome
situation in
Haiti.may
IOMnot
Haiti.
Due
percentages
totalFor
100.more
information on terms and conditions for DTM reports and information products, please see: https://dtm.iom.int/terms-and-conditions.
�HAITI – MOBILITY TRACKING
Displacement situation in Haiti – September 2025
Collecte
descollection:
données :
Data
août––20
04September
septembre2025
2024
1 01
August
Publication
: 22 septembre
2024
Publication:
October 2025
IDPs’ HOST LOCATIONS
Figure 5. Number of IDPs per site and host department
Figure 6. Number and proportion of IDPs per host region
Host regions
MAPAP
Outside MAPAP
South
South-East
Great South
(39%)
Grande'Anse
Nippes
Centre
Centre
(14%)
Artibonite
Artibonite
(9%)
North
Great North
North-West
(10%)
North-East
TOTAL
West (28%)
Displaced
households
# of IDPs
% of IDPs
78,462
19,994
44,688
35,620
27,843
16,471
293,410
100,020
200,907
161,291
126,386
64,439
21%
7%
14%
11%
9%
5%
44,243
199,258
14%
26,991
121,896
9%
24,802
4,368
1,303
324,785
118,840
19,112
6,640
1,412,199
8%
1%
1%
100%
Figure 7. Proportion of IDPs in host families and sites per host region
IDPs in host
Host regions
# of IDPs
IDPs in sites
families
293,410
MAPAP
34%
66%
West
Outside
100,020
98%
2%
MAPAP
The majority of IDPs are hosted in provinces (79% vs 21% in the MAPAP). This proportion
200,907
0.07%
South
100%
has increased slightly compared to Round 10 (77% of IDPs were hosted in provinces),
161,291
South-East
100%
0%
following increases in the number of IDPs in the Centre and Artibonite departments, where Great South Grande'Anse
126,386
100%
0%
armed attacks have recently forced many people to displace (see page 9 for more details).
64,439
Nippes
100%
0%
199,258
95%
5%
Centre
Centre
Almost all IDPs in provinces (98%) continue to be hosted outside of sites (either with host
families or rented accommodations), while in the capital, the majority are hosted in Artibonite
Artibonite
spontaneous sites (66%). Of the 238 spontaneous sites, 97 sites (41%) are located in the
North
capital and 141 (59%) in provinces. However, the number of people in sites remains higher Great North North-West
in the capital as sites in the capital are more densely populated. On average, a site in the
North-East
capital hosts 1,992 people compared to 132 in provinces.
TOTAL
INTERNATIONAL ORGANIZATION FOR MIGRATIONS
Website: https://dtm.iom.int/haiti
Contact: dtmhaiti@iom.int
# of sites
97
15
2
0
0
0
87
121,896
96%
4%
29
118,840
19,112
6,640
1,412,199
99%
100%
97%
85%
1%
0%
3%
15%
7
0
1
238
La citation
suivantecitation
est This
requise
lors
données
et informations
incluses
dans
ce rapport
Organisation
Internationale
The following
ismap
required
when
usingdes
the
data and
in this
report:
“International
Organization
for
is de
forl’utilisation
illustration
purposes
only.
Names andincluded
boundaries
on
this
map: «do
not imply official
pour les
Migrations
(OIM),
septembre
2024,
Evaluationsby
de la
situation
de of the
déplacement
en Haïti. OIM
Haïtiin» Haiti.
Pour plus
d'informations
sur
Migration
(IOM),
Round
9
December
2024,
DTM
Assessment
displacement
situation
IOM Haiti.
For more
endorsement
or
acceptance
IOM.
6
les termes
et on
conditions
des
rapports
et des
produits
d'informations
DTM,
veuillez
https://dtm.iom.int/terms-and-conditions
information
terms
andto
conditions
forome
DTM
reports
and
information
products,
please :
see:
https://dtm.iom.int/terms-and-conditions.
Due
rounding,
percentages
may
not
total
100.consulter
�HAITI – MOBILITY TRACKING
Displacement situation in Haiti – September 2025
Figure 8. IDPs by municipality (admin 2)
Delmas
Delmas
Port-au-Prince
Figure 9. IDPs by municipality section (admin 3)
Collecte
descollection:
données :
Data
août––20
04September
septembre 2025
2024
1 01
August
Publication
: 22 septembre
2024
Publication:
October 2025
Figure 10. Main IDPs’ host municipalities
Municipality
Department
# of IDPs
% of IDPs
Port-au-Prince
Ouest
163,811
12%
Belladère
Centre
110,241
8%
Delmas
Ouest
76,678
5%
Jacmel
Sud-Est
65,052
5%
Cap-Haïtien
Nord
53,516
4%
Léogâne
Ouest
53,088
4%
Les Cayes
Sud
45,794
3%
Verrettes
Artibonite
45,525
3%
Hinche
Centre
34,618
2%
Aquin
Sud
26,892
2%
Jérémie
Grande'Anse
26,251
2%
Cavaillon
Sud
24,513
2%
The municipality of Port-au-Prince continues to be the leading host municipality for IDPs
in the country, hosting 12 per cent of IDPs. These are exclusively IDPs who were
displaced between different neighbourhoods within the same municipality.
The municipality of Belladère, in the Centre department, has seen a significant increase in
the number of IDPs being hosted there (+302% compared to Round 10), making it the
second largest host municipality for IDPs in the country. This is due to displacement
caused by fear generated by attacks in certain localities in the neighbouring municipality of
Lascahobas.
INTERNATIONAL
ORGANIZATION FOR MIGRATIONS
INTERNATIONAL ORGANIZATION
FOR MIGRATIONS
Website: https://dtm.iom.int/haiti Website: https://dtm.iom.int/haiti
Contact: dtmhaiti@iom.int
Contact: dtmhaiti@iom.int
La citation
suivantecitation
est These
requise
lors de
l’utilisation
etonly.
informations
incluses dans
ce on
rapport
« Organisation
Internationale
The following
is maps
required
when
usingdes
thedonnées
data
and
included
in
this
report:
“International
Organization
is for
illustration
purposes
Names and
boundaries
these: maps
do not imply
officialfor
pour les7
Migrations
(OIM),
septembre
2024,
Evaluationsby
de la
situation
de of the
déplacement
en Haïti. OIM
Haïtiin» Haiti.
Pour plus
d'informations
sur
Migration
(IOM),
Round
9
December
2024,
DTM
Assessment
displacement
situation
IOM Haiti.
For more
endorsement
or
acceptance
IOM.
les termes
et on
conditions
des
rapports
et des
produits
d'informations
DTM,
veuillez
https://dtm.iom.int/terms-and-conditions
information
terms
andto
conditions
forome
DTM
reports
and
information
products,
please :
see:
https://dtm.iom.int/terms-and-conditions.
Due
rounding,
percentages
may
not
total
100.consulter
�HAITI – MOBILITY TRACKING
Displacement situation in Haiti – September 2025
Collecte
descollection:
données :
Data
août––20
04September
septembre2025
2024
1 01
August
Publication
: 22 septembre
2024
Publication:
October 2025
Figure 11. Evolution of the displacement situation between 2022 and September 2025
810% increase in the number of IDPs over two and a half years (comparison of the situation between the end of 2022 vs. mid 2025)
232% increase in the number of IDPs during the year 2024
(comparison of the situation between the end of 2023 vs. the
end of 2024)
36% increase in the number of
IDPs between end of 2024
and September 2025
1412199
1287593
102% increase in the number of IDPs during
the year 2023 (comparison of the situation
between the end of 2022 vs. the end of 2023)
1041229
702973
578074
362551
313901
155166
113582
Round 1
Round 2
(September 2022) (November 2022)
194,624
127,977
Round 3 (March
2023)
Round 4 (June
2023)
2022
INTERNATIONAL ORGANIZATION FOR MIGRATIONS
Website: https://dtm.iom.int/haiti
Contact: dtmhaiti@iom.int
Round 5
(December 2023)
Round 6 (March
2024)
2023
Round 7 (June
2024)
Round 8
Round 9
(September 2024) (December 2024)
2024
8
Round 10 (June
2025)
Round 11
(September 2025)
2025
�HAITI – MOBILITY TRACKING
Displacement situation in Haiti – September 2025
Data collection:
1 August – 20 September 2025
Publication: October 2025
Figure 12. Variations in the number of IDPs between Round 10 and 11, by hosting area
Hosting area
West
Delmas
Great South
Centre
Artibonite
Great North
Port-au-Prince
MAPAP
Outside MAPAP
South
Delmas
South-East
Grande'Anse
Nippes
Centre
Artibonite
North
North-West
North-East
TOTAL
# of IDPs in
# of IDPs in Round
Round 10
11
293,410
296,936
100,020
116,280
200,907
185,673
161,291
143,183
126,386
112,025
64,439
56,887
199,258
147,230
121,896
92,304
118,840
115,657
19,112
16,984
6,640
4,434
1,287,593
1,412,199
% of variation
-1%
-14%
+8%
+13%
+13%
+13%
+35%
+32%
+3%
+13%
+50%
10%
# of sites in Round 10
97
17
2
0
0
0
85
34
7
1
3
246
# of sites in Round 11
97
15
2
0
0
0
87
29
7
0
1
238
Between Rounds 10 and 11, the number of IDPs increased by 10 per cent, from 1,287,593 to 1,412,199. This increase is primarily due to the
deterioration of the security situation in the Artibonite and Central departments, where the increases were most significant.
The number of IDPs in the Central department increased from 147,230 in Round 10 to 199,258 (+35%) following preventive displacements caused by
attacks in communities bordering Mirebalais and Lascahobas. In the Artibonite department, the number of IDPs increased from 92,304 to 121,896
(+32%) following several armed attacks in this department, particularly in the municipalities of La Chapelle, Dessalines, Verrettes, and Petite Rivière.
The trend toward a greater increase in the number of IDPs in provinces than in the capital continued to be observed during this round. While the
number of IDPs in the MAPAP decreased slightly (-1%), it continued to increase in provinces. Unlike in previous years, in 2025, the majority of armed
attacks resulting in mass displacement took place in provinces: of all displacements observed by the DTM’s Emergency Tracking Tool so far in 2025,
only 31 per cent were due to attacks in the capital compared to 69 per cent in provinces, particularly in the Centre (38% of mass displacements
observed in 2025) and Artibonite (26%) (see the emergency tracking dataset).
In 2024, 76 per cent of the total mass displacements observed were due to attacks in the capital compared to 24 per cent in the provinces. In 2023,
68 per cent of mass displacements were caused by attacks in the capital, compared to 32 per cent in the provinces. This demonstrates a growing
deterioration in the security situation beyond the capital in 2025, mainly in the Artibonite and Centre departments.
INTERNATIONAL ORGANIZATION FOR MIGRATIONS
Website: https://dtm.iom.int/haiti
Contact: dtmhaiti@iom.int
9
�HAÏTI – SUIVI
DE–MOBILITY
MOUVEMENT
DES
POPULATIONS
HAITI
TRACKING
HAITI
MOBILITY
TRACKING
Displacement
situation
in Haiti
– June 2025
Displacement
situation
in Haiti
– September
2025
Collecte des données :
Data collection:
21 avril –
1 August21
– 20
April – 3
September
June 2025
3 juin 2025
Publication:
Publication : 10
October
June 2025
Publication : 10 juin 2025
Figure 13. Evolution of the displacement situation in host municipalities from the end of 2023 to September 2025
Round 5 (December 2023)
Round 7 (June 2024)
Round 10 (June 2025)
Round 11 (September 2025)
INTERNATIONAL ORGANIZATION FOR MIGRATIONS
Website: https://dtm.iom.int/haiti
Contact: dtmhaiti@iom.int
Round 9 (December 2024)
10
These maps is for illustration purposes only. Names and boundaries on these maps do not imply official
endorsement or acceptance by IOM.
�HAITI – MOBILITY TRACKING
Displacement situation in Haiti – September 2025
Collecte
descollection:
données :
Data
août––20
04September
septembre2025
2024
1 01
August
Publication
: 22 septembre
2024
Publication:
October 2025
IDPs’ ORIGINS
Figure 15. IDPs by municipality of origin (admin 2)
Figure 14. IDPs by department of origin (admin 1)
Figure 16. IDPs’ main municipalities of origin
Croix-Des-Bouquets
Kenscoff
Other
West (74%)
16%
1%
5%
4%
Other
2%
6%
Petite Rivière de
l'Artibonite
5%
Other
7%
Mirebalais
9%
Carrefour
Gressier
Port-au-Prince
15%
Delmas
30%
The West Department remains the main area of provenance of IDPs (74%),
particularly the country's capital, the MAPAP, which alone represents the
provenance of 54 per cent of IDPs.
Apart from the MAPAP, armed attacks in the Centre and Artibonite departments
make these two departments the other areas of origin of IDPs in the country.
Centre (17%) Artibonite (9%)
INTERNATIONAL
ORGANIZATION FOR MIGRATIONS
INTERNATIONAL ORGANIZATION
FOR MIGRATIONS
Website: https://dtm.iom.int/haitiWebsite: https://dtm.iom.int/haiti
Contact: dtmhaiti@iom.int
Contact: dtmhaiti@iom.int
La citation
suivantecitation
est These
requise
lors de
l’utilisation
etonly.
informations
incluses dans
ce on
rapport
« Organisation
Internationale
The following
is maps
required
when
usingdes
thedonnées
data
and
included
in
this
report:
“International
Organization
is for
illustration
purposes
Names and
boundaries
these: maps
do not imply
officialfor
pour les
Migrations
(OIM),
septembre
2024,
Evaluationsby
de la
situation
de of the
déplacement
en Haïti. OIM
Haïtiin» Haiti.
Pour plus
d'informations
sur
Migration
(IOM),
Round
9
December
2024,
DTM
Assessment
displacement
situation
IOM Haiti.
For more
endorsement
or
acceptance
IOM.
11
les termes
et on
conditions
des
rapports
et des
produits
d'informations
DTM,
veuillez
https://dtm.iom.int/terms-and-conditions
information
terms
andto
conditions
forome
DTM
reports
and
information
products,
please :
see:
https://dtm.iom.int/terms-and-conditions.
Due
rounding,
percentages
may
not
total
100.consulter
�HAITI – MOBILITY TRACKING
Displacement situation in Haiti – September 2025
Figure 17. Origin (left) and host departments (right) of IDPs
Data collection:
1 August – 20 September 2025
Publication: October 2025
Figure 18. Municipalities of origin of IDPs by host departments
North-East
North-West
Nippes
North
Artibonite
Grande'Anse
South-East
Centre
South
West
0%
20%
40%
60%
80%
100%
Port-au-Prince
Mirebalais
Gressier
Delmas
Carrefour
Croix-Des-Bouquets
Petite Rivière de l'Artibonite
Kenscoff
Cité Soleil
La Chapelle
Dessalines
Arcahaie
Léogâne
Tabarre
Pétion-Ville
Cabaret
L'Estère
Verrettes
Savanette
Pointe à Raquette
Anse à Galets
Saut d'Eau
Desdunes
Saint-Marc
Grande Saline
Lascahobas
Saint-Michel de l'Attalaye
IDPs from the West Department (largely made up of the capital) are hosted in all 10 departments of the country (see Figure 17). This is particularly true for IDPs who fled
neighbourhoods in the municipality of Port-au-Prince, who are present in all departments except the Centre (Figure 18). Moreover, the West Department almost exclusively hosts
IDPs from the same department: 98 per cent of IDPs in the West Department fled areas within the same department. In the country's capital, the MAPAP, almost all IDPs came
from the same area: indeed, 98 per cent of IDPs in the MAPAP came from other neighbourhoods within the MAPAP.
IDPs from areas within the Centre Department took refuge primarily within the same department and then to the North, and to a lesser extent to the Northeast, Northwest, and
West (Figure 17). Furthermore, unlike in previous years, the majority of IDPs in the provinces no longer come from the MAPAP but from other areas of the provinces: 42 per cent
of IDPs who are from the provinces came from the capital (compared to 45% in round 10 and 56% in round 9) compared to 58 per cent from other areas in the provinces,
notably from Gressier, Mirebalais and Petite Rivière of Artibonite (Figure 16). This demonstrates once again an intensification of armed violence outside the capital, spreading
increasingly towards provinces and generating significant population displacements there.
INTERNATIONAL ORGANIZATION FOR MIGRATIONS
Website: https://dtm.iom.int/haiti
Contact: dtmhaiti@iom.int
12
�HAITI – MOBILITY TRACKING
Displacement situation in Haiti – September 2025
PERIOD OF DISPLACEMENT
Collecte
descollection:
données :
Data
août––20
04September
septembre2025
2024
1 01
August
Publication
: 22 septembre
2024
Publication:
October 2025
REASONS FOR DISPLACEMENT
Figure 19. Period of displacement
43%
41%
Figure 20. Reasons for displacement
Reason for IDPs’ displacement
12%
%
Attacks / Violence
97%
Preventive displacement / Fear of attacks
2%
Natural disaster
1%
2%
2%
2021
2022
2023
2024
2025
It is important to note that the periods of displacement are those of individuals who
are still displaced today, and do not consider individuals who were displaced but have
since returned home. As such, it does not present the overall evolution or the
cumulative number of displacements for a given year but rather reflects the periods
marking the beginning of displacement for currently displaced individuals.
Armed violence is the reason for displacement for almost all IDPs in
Haiti, with 97 per cent of displacements reported due to attacks and 2
per cent due to fear of them.
The year 2024 is the period of displacement for almost half (43%) of the persons
currently displaced, followed by 2025 (41%): 84 per cent of IDPs were displaced
during these two years.
INTERNATIONAL ORGANIZATION
ORGANISATION
FOR MIGRATIONS
INTERNATIONALE POUR LES MIGRATIONS
Website: https://dtm.iom.int/haiti
Site web: https://dtm.iom.int/haiti
Contact: dtmhaiti@iom.int Contact: dtmhaiti@iom.int
La citation
suivantecitation
est requise
lors de l’utilisation
et informations included
incluses dans
ce report:
rapport “International
: « Organisation
Internationale
The following
is required
when usingdes
thedonnées
data and
in this
Organization
for
pour les
Migrations
(OIM),
septembre
2024, 2024,
Evaluations
de la situation
de of the
déplacement
en Haïti. OIM
Haïtiin» Haiti.
Pour plus
d'informations
sur
Migration
(IOM),
Round 9
- December
DTM
Assessment
displacement
situation
IOM Haiti.
For more
13
les termes
et on
conditions
et des
produits
d'informations
DTM, veuillez
consulter
https://dtm.iom.int/terms-and-conditions
information
termsdes
andrapports
conditions
for DTM
reports and
information
products,
please :
see:
https://dtm.iom.int/terms-and-conditions.
�HAITI – MOBILITY TRACKING
Displacement situation in Haiti – September 2025
PRIORITY NEEDS
Collecte
descollection:
données :
Data
août––20
04September
septembre2025
2024
1 01
August
Publication
: 22 septembre
2024
Publication:
October 2025
Figure 22. Priority needs of IDPs out of sites*
Figure 21. Priority Needs of IDPs (% of host locations where each need was mentioned among
the top 3 priority needs)*
Food
79%
Livelihood
63%
WASH
36%
Shelter
36%
Health
35%
Education
28%
Non-Food Items
9%
Protection
9%
77%
Livelihood
61%
Health
39%
WASH
37%
Shelter
37%
Education
28%
Non-Food Items
8%
Protection
8%
Figure 23. Priority needs of IDPs in sites*
Food needs were most frequently mentioned in IDP-hosting locations (79% of
locations).
Access to livelihoods (63%), water, hygiene, and sanitation (WASH) (36%),
shelter (36%), and healthcare (35%) were the most frequently mentioned after
food.
Furthermore, there are some differences in priority needs between IDPs living
outside sites and those in sites. For example, health needs were more frequently
mentioned outside sites than in sites (39% vs. 20%) (see figures 22 and 23).
*Multiple answers possible
ORGANISATION
INTERNATIONALE POUR LES MIGRATIONS
INTERNATIONAL ORGANIZATION
FOR MIGRATIONS
Site web: https://dtm.iom.int/haiti
Website: https://dtm.iom.int/haiti
Contact: dtmhaiti@iom.int
Contact: dtmhaiti@iom.int
Food
14
Food
84%
Livelihood
64%
Shelter
39%
WASH
37%
Education
30%
Health
20%
Non-Food Items
14%
Protection
7%
�HAITI – MOBILITY TRACKING
Displacement situation in Haiti – September 2025
FOCUS ON THE METROPOLITAN AREA OF PORT-AU-PRINCE
(September 2025)
78,462
293,410
Round 10
Displaced households
Internally Displaced
Persons
Round 11
(June 2025)
Round 9
-1%
(December 2024)
Variation in the number of IDPs
compared to Round 10
(September 2024)
66%
of IDPs in host families/
out of sites
97
in site
sites
(same as in
Round 10)
Round 7
(June 2024)
Round 6
(March 2024)
Figure 24. IDPs by host municipality in MAPAP
Municipalities
Displaced
households
# of IDPs
-1% 293,410
Closure of some major sites through an IDPs relocation program by government
institutions.
+14% 296,936
Armed violence intensified during the first quarter of 2025 (see ETT 56, 57.3 and 60).
+51% 261,448
Widespread violence in the MAPAP causing mass displacement in several neighbourhoods
of the capital (see ETT 51.2, 52.2 and 53.1).
Round 8
34%
Data collection:
1 August – 20 September 2025
Publication : October 2025
-6% 173,156
Continual departure of populations to provinces but also certain returns of IDPs observed
in certain areas of the MAPAP, notably in certain neighbourhoods of Cité Soleil.
+15% 184,789
Increased armed attacks by a coalition of different MAPAP gang groups and the resulting
widespread insecurity, pushing thousands of people to flee MAPAP to the provinces and
others to move between different neighbourhoods within MAPAP.
+15% 160,550
After a relative decrease in security incidents in late 2023, the beginning of 2024 saw a
significant increase in these incidents, forcing more and more people to flee their homes. In
particular, the attacks in Solino and Gabelliste in January 2024 (see ETT 34.1), in Carrefour
in January 2024 (ETT 35), in Pétion-ville, Port-au-Prince and Cité soleil in January 2024
(ETT 36.1), in Carrefour, Cité Soleil and Tabarre in February 2024 (ETT 37.1).
% of IDPs
Port-au-Prince
Delmas
Pétion-Ville
Cité Soleil
Carrefour
Croix-DesBouquets
Tabarre
43,628
22,070
4,567
3,585
2,380
163,811
76,678
20,505
14,120
9,622
56%
26%
7%
5%
3%
1,204
5,184
2%
1,028
3,490
1%
TOTAL
78,462
293,410
100%
Round 5
(Nov 2023)
Round 4
(June 2023)
+7% 139,853
The increase is mainly due to armed attacks that occurred in the Carrefour-Feuilles and
Savanes-Pistaches neighbourhoods in August 2023 (ETT 22.5).
+2% 130,884
Slight increase mainly due to flooding in early June 2023 (see ETT 18.3).
Round 3
(March 2023)
Round 2
(Nov 2022)
Round 1
(August 2022)
-18% 127,977
This decrease was mainly due to a relative drop in security incidents in MAPAP at the end
of 2022 and the beginning of 2023.
+77% 155,166
This significant increase was due to the deterioration of the general situation in MAPAP
following social protest movements, sometimes violent, particularly due to the increase in
the price of fuel.
87,895
�HAITI – MOBILITY TRACKING
Displacement situation in Haiti – September 2025
Figure 25. Displacement situation in the neighbourhoods of the MAPAP
Data collection:
1 August – 20 September 2025
Publication: October 2025
Figure 26. IDPs out of sites vs. in sites by host municipality in the MAPAP
IDPs in
IDPs in
host
sites
families
13%
87%
Municipalities
# of IDPs
# of sites
Port-au-Prince
163,811
Delmas
76,678
61%
39%
18
Pétion-Ville
20,505
72%
28%
5
Cité Soleil
14,120
16%
84%
12
Carrefour
Croix-DesBouquets
Tabarre
9,622
84%
16%
4
5,184
95%
5%
1
3,490
80%
20%
3
TOTAL
293,410
34%
66%
97
54
Figure 27. Top 10 neighbourhoods hosting IDPs in the MAPAP
Of all IDPs in the capital, 66 per cent are hosted in spontaneous sites, making the MAPAP the only
area in the country where the majority of IDPs are hosted in sites.
More than half of the IDPs in the capital (56%) are still hosted in the municipality of Port-au-Prince,
largely in spontaneous sites: of the 97 sites in the capital, 54 are located in this municipality. The
municipality of Delmas remains in second place, hosting 26 per cent of IDPs in the capital.
Furthermore, it should be noted that 40 per cent of IDPs in the MAPAP are hosted in just 10
neighborhoods (out of the 429 in the MAPAP). This demonstrates a high density of IDPs in the few
areas of the capital that still provide a relative sense of security.
INTERNATIONAL ORGANIZATION FOR MIGRATIONS
Website: https://dtm.iom.int/haiti
Contact: dtmhaiti@iom.int
16
Neighborhood
Municipality
# of IDPs
% of IDPs in
the MAPAP
Bois Verna
Bourdon
Delmas 2 - SaintMartin - Tokyo
Port-au-Prince
Port-au-Prince
29,787
12,671
10%
4%
Port-au-Prince
12,550
4%
Christ-Roi - Lalue
Port-au-Prince
11,620
4%
Bas Martissant
Port-au-Prince
Cite Plus
Port-au-Prince
Bolosse
Port-au-Prince
Kernizan - Defilee Charlemagne
Delmas
Peralte
9,845
9,306
8,413
3%
3%
3%
8,266
3%
Siloe
Delmas
6,691
2%
Cite Louverture
Port-au-Prince
6,555
2%
This map is for illustration purposes only. Names and boundaries on this map do not imply official
endorsement or acceptance by IOM.
Due to rounding, some percentages may not total 100.
�HAITI – MOBILITY TRACKING
Displacement situation in Haiti – September 2025
Data collection:
1 August – 20 September 2025
Publication: October 2025
Figure 28. Spontaneous sites in the MAPAP
On average, a site in the MAPAP hosts 1,992 IDPs (compared to 2,000 in
Round 10). The average number of IDPs per site thus decreased slightly,
even though the number of sites remained the same (97 sites). A
relocation program implemented by government institutions allowed the
closure of some large spontaneous sites, which explains the slight
decrease in IDPs in sites. The number of sites remained the same due to
the creation of new sites in certain neighbourhoods of the capital.
Furthermore, the distribution of IDPs accommodated outside and inside
sites has not changed compared to Round 10 (66% of IDPs are in the
sites versus 34% living outside). This distribution has not changed
drastically since 2024 (see Figure 29).
108
Figure 29. Evolution of the proportions of IDPs in host families/out of sites vs. in sites from 2022 to 2025
86
75%
62%
51
58
36
25%
25%
Round 1 (August
2022)
Round 2
(November
2022)
97
95
97
73%
75%
50
96
45%
38%
Round 3 (March
2023)
55%
Round 4 (June
2023)
58%
61%
61%
42%
39%
39%
Round 5
(November
2023)
Round 6 (March
2024)
IDPs in host families/out of sites
INTERNATIONAL ORGANIZATION FOR MIGRATIONS
Website: https://dtm.iom.int/haiti
Contact: dtmhaiti@iom.int
Round 7 (June
2024)
IDPs in sites
17
63%
37%
Round 8
(September
2024)
65%
66%
35%
34%
Round 9
Round 10 (June
(December 2024)
2025)
66%
34%
Round 11
(September
2025)
# of sites
This map is for illustration purposes only. Names and boundaries on this map do not imply official
endorsement or acceptance by IOM.
�HAITI – MOBILITY TRACKING
Displacement situation in Haiti – September 2025
Data collection:
1 August – 20 September 2025
Publication: October 2025
Figure 31. IDPs by type of site in MAPAP
Figure 30. Types of site in MAPAP
Types of sites
# of sites # of IDPs in sites
% of IDPs in
sites
Schools
32
71,970
37%
Uncovered and fenced area
21
41,802
22%
Covered and fenced area
16
37,304
19%
Church/Temple
21
33,434
17%
Uncovered and unfenced space
5
6,783
4%
Covered and unfenced space
2
1,884
1%
97
193,177
100%
TOTAL
Of the IDPs hosted in sites in the capital, 37 per cent are accommodated in
schools, with nearly 72,000 people in 32 schools. The number of schools
hosting IDPs has decreased slightly compared to Round 10, from 35 to 32
schools. The number of IDPs hosted there has also decreased by 10 per
cent, from 79,103 to 71,970 people. This is explained by the fact that the
relocation program implemented by government institutions primarily targets
IDPs hosted in schools.
INTERNATIONAL ORGANIZATION FOR MIGRATIONS
Website: https://dtm.iom.int/haiti
Contact: dtmhaiti@iom.int
18
This map is for illustration purposes only. Names and boundaries on this map do not imply official
endorsement or acceptance by IOM.
Due to rounding, some percentages may not total 100.
�HAITI – MOBILITY TRACKING
Displacement situation in Haiti – September 2025
FOCUS ON MUNICIPALITIES IN THE WEST, OUTSIDE MAPAP
Figure 33. IDPs’ host locations in West department, outside MAPAP
19,994
100,020
Displaced households
Internally Displaced
Persons
-14%
Data collection:
1 August – 20 September 2025
Publication: October 2025
Variation in the number of IDPs
compared to Round 10
98%
of IDPs in host families/
out of sites
(-2 sites
15 compared
to
2%
sites
in sites
Round 10)
Figure 32. IDPs per host municipality in the West, outside MAPAP
Municipalities
Léogâne
# of
displaced # of IDPs % of IDPs
households
11,256
53,088
53%
# of sites
7
Arcahaie
2,500
14,190
14%
2
Cabaret
2,245
11,904
12%
1
Grand-Goâve
926
6,796
7%
0
Pointe à Raquette
884
4,873
5%
0
Anse à Galets
617
3,045
3%
0
Petit-Goâve
629
2,471
2%
0
Cornillon / Grand Bois
553
2,142
2%
1
Kenscoff
384
1,511
2%
4
TOTAL
19,994
100,020
INTERNATIONAL ORGANIZATION FOR MIGRATIONS
Website: https://dtm.iom.int/haiti
Contact: dtmhaiti@iom.int
100%
Around 100,000 people are internally displaced in areas outside the MAPAP in the West
Department, a 14 per cent decrease compared to Round 10. This decrease is due to the
return of a majority of IDPs who were displaced in the municipality of Cabaret, as well as
the departure of a significant number of IDPs who were in Petit-Goâve to other parts of
the country.
Gressier represents the origin of nearly half of the IDPs in these areas outside the
MAMAP in the West, a municipality almost emptied of its population.
Figure 34. Municipalities of origin of IDPs located in the West, outside MAPAP
45%
15
16%
15%
7%
6%
Gressier
Arcahaie
Léogâne
Mirebalais
Pointe à Raquette
Anse à Galets
Port-au-Prince
Other
Autres
19
3%
3% 2%
3%
Cabaret
This map is for illustration purposes only. Names and boundaries on this map do not imply official
endorsement or acceptance by IOM.
Due to rounding, some percentages may not total 100.
�HAITI – MOBILITY TRACKING
Displacement situation in Haiti – September 2025
FOCUS ON THE GREAT SOUTH
124,622
553,023
Displaced households
Internally Displaced
Persons
+11%
Increase in the number of IDPs
compared to Round 10
99.98%
of IDPs in host families/
out of sites
Data collection:
1 August – 20 September 2025
Publication: October 2025
The number of IDPs in the four departments of the Great South (South, South-East,
Grande’Anse, and Nippes) increased by 11 per cent compared to Round 10, due to continued
arrivals from the capital. However, this is the smallest increase observed in the Great South in
over a year. Indeed, the main municipalities of origin of IDPs hosted in the Great South are
located in the capital (67% of IDPs in the Great South came from the capital; see Figure 36).
Unlike in 2023 and 2024, in 2025, these areas did not experience intensive attacks, thus reducing
the number of displacements from the capital. During this year, armed attacks occurred more in
the Centre and Artibonite departments, pushing people to move within these departments and
towards the Great North in general.
Figure 36. Municipalities of origin for IDPs living in the Great South
0.02%
2
in sites
sites
(same as in
Round 10)
34%
29%
16%
9%
1%
6%
3%
1%
Figure 35. IDPs’ host locations in the Great South
INTERNATIONAL ORGANIZATION FOR MIGRATIONS
Website: https://dtm.iom.int/haiti
Contact: dtmhaiti@iom.int
20
<1%
Port-au-Prince
Gressier
Carrefour
Delmas
Croix-Des-Bouquets
Kenscoff
Cité Soleil
Tabarre
Pétion-Ville
This map is for illustration purposes only. Names and boundaries on this map do not imply
official endorsement or acceptance by IOM.
* Due to rounding, some percentages may not total 100.
�HAITI – MOBILITY TRACKING
Displacement situation in Haiti – September 2025
Figure 38. IDPs’ host locations in the Centre
FOCUS ON CENTRE DEPARTMENT
44,243
199,258
Displaced households
Internally Displaced
Persons
+35%
Data collection:
1 August – 20 September 2025
Publication: October 2025
Increase in the number of IDPs
compared to Round 10
95%
of IDPs in host families/
out of sites
5%
(+2 sites
87 compared
to
sites
in sites
Round 10)
Figure 37. IDPs by hosting municipalities in the Centre
Municipalities
Displaced households # of IDPs % of IDPs
# of
sites
Belladère
Hinche
25,133
7,618
110,241
34,618
55%
17%
20
26
Boucan Carré
3,042
13,072
7%
16
Thomassique
1,728
8,594
4%
1
Thomonde
1,576
6,872
3%
5
Maïssade
1,062
5,695
3%
0
Lascahobas
1,100
5,490
3%
7
Savanette
972
4,876
2%
9
Mirebalais
950
4,750
2%
0
Cerca Carvajal
768
3,837
2%
3
Cerca La Source
189
688
<1%
0
Saut d'Eau
105
525
<1%
0
TOTAL
44,243
199,258
100%
87
INTERNATIONAL ORGANIZATION FOR MIGRATIONS
Website: https://dtm.iom.int/haiti
Contact: dtmhaiti@iom.int
The Centre continues to see the number of IDPs hosted there increase. Armed attacks that
occurred in July 2025 in localities bordering the municipalities of Mirebalais and Lascahobas created
a climate of fear among the population of this area and led to preventive displacements to the
municipality of Belladère, which has become the first municipality hosting IDPs in the Centre
department and the second nationally. Furthermore, this commune is the main entry point for
people deported from the Dominican Republic (96% of people deported so far in 2025 were
deported through the Belladère entry point) (see IOM deportation flow monitoring). Basic services
and resources of host communities in this municipality are therefore under significant pressure.
Figure 39. Municipalities of origin for IDPs living in Centre
96%
Mirebalais
21
2%
1%
<1%
<1%
Savanette
Saut d'Eau
Boucan Carré
Lascahobas
This map is for illustration purposes only. Names and boundaries on this map do not imply official
endorsement or acceptance by IOM.
Due to rounding, some percentages may not total 100.
�HAITI – MOBILITY TRACKING
Displacement situation in Haiti – September 2025
Data collection:
1 August – 20 September 2025
Publication: October 2025
Figure 41. IDPs by types of sites in the Centre
Figure 40. Types of sites in the Centre
Types of sites
# of sites
# of IDPs
% of IDPs
Schools
48
7,031
67%
Uncovered and fenced area
7
1,382
13%
Covered and fenced area
17
1,315
13%
Church/Temple
12
600
6%
Covered and unfenced space
1
100
1%
Uncovered and unfenced space
2
83
1%
TOTAL
87
10,511
100%
After the MAPAP, the Centre continues to be the area with the largest number of spontaneous sites. However, the difference is that sites in the Centre are
sparsely populated compared to those in the MAPAP. A total of 10,511 IDPs are hosted in the 87 spontaneous sites in the Centre, which represents 5 per cent of
the total IDPs in the department. On average, a site in Centre accommodates 121 people.
Schools are the most commonly used places for IDPs in sites, accommodating 67 per cent of IDPs in sites in the Centre, or 7,031 people.
INTERNATIONAL ORGANIZATION FOR MIGRATIONS
Website: https://dtm.iom.int/haiti
Contact: dtmhaiti@iom.int
22
This map is for illustration purposes only. Names and boundaries on this map do not imply official
endorsement or acceptance by IOM.
Due to rounding, some percentages may not total 100.
�HAITI – MOBILITY TRACKING
Displacement situation in Haiti – September 2025
Figure 43. IDPs’ host locations in the Artibonite department
FOCUS ON ARTIBONITE DEPARTMENT
26,991
121,896
Displaced households
Internally Displaced
Persons
+32%
Data collection:
1 August – 20 September 2025
Publication: October 2025
Increase in the number of IDPs
compared to Round 10
96%
of IDPs in host families/
out of sites
4%
in sites
29
(-5 sites
compared to
Round 10)
sites
Figure 42. IDPs per host municipality in the Artibonite department
# of sites
16
2,163
1,868
1,427
1,000
711
460
785
364
210
270
71
85
26,991
11,909
8,813
7,005
4,000
3,485
2,300
2,017
1,828
1,160
1,080
465
317
121,896
10%
7%
6%
3%
3%
2%
2%
1%
1%
1%
<1%
<1%
100%
0
0
0
0
1
7
0
2
0
0
0
0
29
INTERNATIONAL ORGANIZATION FOR MIGRATIONS
Website: https://dtm.iom.int/haiti
Contact: dtmhaiti@iom.int
Figure 44. Municipalities of origin for IDPs living in the Artibonite department
39%
16%
15%
7%
6%
1%
1%
1%
6%
2%
Artibonite (86%)
2%
2%
1%
Autre
Saint-Michel de l'Attalaye
Gonaïves
Gros Morne
Anse Rouge
Ennery
Petite Rivière de l'Artibonite
Terre Neuve
La Chapelle
Marmelade
Grande Saline
L'Estère
Desdunes
TOTAL
Croix-DesBouquets
2
Kenscoff
13%
Cabaret
15,286
Port-au-Prince
3,112
Other
Autre
Saint-Marc
The number of IDPs in Artibonite increased by 32 per cent due to further intensified attacks
between July and September 2025, particularly in the municipalities of La Chapelle, Dessalines,
Verrettes, and Petite Rivière. Artibonite and Centre are the only departments in the country where
the majority of IDPs do not come from the West: in Artibonite, 86 per cent of IDPs fled areas
within the same department, a significant increase compared to Round 10, when this proportion
was 61 per cent. La Chapelle, for example, has become a major provenance of IDPs, whereas it
was not during Round 10..
Grande Saline
1
Saint-Marc
14%
L'Estère
16,706
Verrettes
4,250
Dessalines
Dessalines
La Chapelle
Verrettes
# of
% of
displaced # of IDPs
IDPs
households
10,215
45,525
37%
Petite Rivière
de l'Artibonite
Municipalities
Ouest (14%)
West
The following citation
required
using the
data and
information
in this
report:
“International
Organization for
Thisismap
is for when
illustration
purposes
only. Names
andincluded
boundaries
on this
map do
not imply official
Migration (IOM), Round
9 December
2024, by
DTMIOM.
Assessment of the displacement situation in Haiti. IOM Haiti. For more
endorsement
or
acceptance
23
information on terms
andto
conditions
DTM reports
and may
information
products,
Due
rounding,forsome
percentages
not total
100. please see: https://dtm.iom.int/terms-and-conditions.
�Data collection:
HAITI – MOBILITY TRACKING
1 August – 20 September 2025
Displacement situation in Haiti – September 2025
Publication: October 2025
FOCUS ON GREAT NORTH
30,473
Displaced households
Internally Displaced
Persons
+5%
Increase in the number of IDPs
compared to Round 10
99%
of IDPs in host families
/out of sites
1%
in sites
8
sites
Figure 46. Municipalities of origin for IDPs living in the Great North
(-3 sites
compared to
Round 10)
Artibonite (14%)
144,592
The number of IDPs in the three departments of the Great North (North, Northeast and
Northwest) increased by 5 per cent between Rounds 10 and 11, following the arrival of
displaced persons fleeing recent attacks in the Centre and Artibonite regions. However,
these arrivals were lower than in Round 10 (an increase of 63 per cent was observed)
because displacements that occurred in recent weeks in Artibonite and Centre regions
have mainly taken place between different municipalities in these departments.
Ouest (64%)
Centre
(22%)
Figure 45. IDPs’ host locations in the Great North departments
Gonaïves
<1%
L'Estère
1%
Desdunes
1%
Petite Rivière de l'Artibonite
Lascahobas
24
1%
Mirebalais
21%
Gressier
<1%
Pétion-Ville
1%
Arcahaie
1%
Tabarre
1%
Cité Soleil
2%
Kenscoff
2%
Carrefour
3%
Croix-Des-Bouquets
7%
Delmas
9%
Port-au-Prince
INTERNATIONAL ORGANIZATION FOR MIGRATIONS
Website: https://dtm.iom.int/haiti
Contact: dtmhaiti@iom.int
12%
38%
This map is for illustration purposes only. Names and boundaries on this map do not imply official
endorsement or acceptance by IOM.
Due to rounding, some percentages may not total 100.
�Data collection:
HAITI – MOBILITY TRACKING
1 August – 20 September 2025
Displacement situation in Haiti – September 2025
Publication: October 2025
Figure 48. Returnees per department
RETURNEES FORMERLY IDPs
92,754
Individuals returned
21,326
Households returned
14%
Increase
compared to
Round 10
Returning area
West
Figure 47. Areas of return
Out of MAPAP
MAPAP
Artibonite
South
Centre
North
TOTAL
# of returned # of returned
households
persons
7,560
35,585
4,124
16,409
5,226
21,537
2,908
11,675
1,431
7,156
77
392
21,326
92,754
% of returned
persons
38%
18%
23%
13%
8%
<1%
100%
Figure 49. Top 10 municipalities of return
Municipality
Department
Cabaret
West
Tiburon
South
Dessalines
Artibonite
Lascahobas
Centre
Croix-DesWest
Bouquets
Verrettes
Artibonite
Port-au-Prince West
Arcahaie
West
Cité Soleil
West
Saint-Marc
Artibonite
# of
# of returnees in Variation compared to
Round 10
returnees
the country
30,200
33%
-1%
9,955
11%
+1%
9,900
11%
+4 400%
7,000
8%
+100%
6,188
7%
+42%
5,811
5,555
3,980
3,533
3,425
6%
6%
4%
4%
4%
+97%
-4%
-49%
-13%
+3%
More than 92,000 IDPs have returned to their places of origin, a 14 per cent increase compared to Round 10. This is explained by some returns observed in some areas
that had recently suffered armed attacks but experienced a relative lull thereafter. This was the case, for example, in the municipality of Dessalines in Artibonite, which
suffered attacks in July 2025 and where populations began to return after a relative lull. The same situation has begun to be observed in the municipality of Lascahobas in
the Centre. Returnees mainly reside in three communes, which alone host 54 per cent of returnees: Cabaret, Tiburon and Dessalines.
INTERNATIONAL ORGANIZATION FOR MIGRATIONS
Website: https://dtm.iom.int/haiti
Contact: dtmhaiti@iom.int
25
This map is for illustration purposes only. Names and boundaries on this map do not imply official
endorsement or acceptance by IOM.
Due to rounding, some percentages may not total 100.
�HAITI – MOBILITY TRACKING
Displacement situation in Haiti – September 2025
METHODOLOGY
The General Directorate of Civil Protection (DGPC) and the IOM
Displacement Tracking Matrix (DTM) have been conducting periodic
assessments of locations hosting displaced populations since August 2022
in order to provide key information on the displacement situation as well
as the living conditions and needs of displaced populations. The objective
is to guide response strategies to the displacement situation, both
humanitarian responses and sustainable solution programs to this
situation.
Data collection:
1 August – 20 September 2025
Publication: October 2025
4,019
1,163
Key informants interviewed
Assessed locations
Figure 50. Locations where field interviews were conducted with key informants during Round 11
Data is collected through direct observation as well as interviews with
key informants at the lowest geographical level, which is the
neighbourhood in the Metropolitan Area of Port-au-Prince (MAPAP),
the communal section outside the MAPAP, and in spontaneous sites
where they exist. On average, three key informants are interviewed in
groups in each locality assessed.
Due to security challenges, some interviews may be conducted remotely
with key informants. During Round 11, data collection was conducted
from 1 August to 20 September 2025. A total of 4,019 key informants
were interviewed in the 1,163 locations assessed, including 507
communal sections out of the MAPAP, 418 neighbourhoods in the
MAPAP and 238 spontaneous sites. Of these locations, 90 per cent were
assessed through field interviews (see Figure 50), while 10 per cent were
assessed by phone.
Limitations:
The information collected represents estimates provided by key
informants for their communities. In order to obtain the best possible
estimates (the closest to reality), assessments are conducted at the
lowest geographical level, and key informants interviewed are the people
with the best knowledge of their communities (see Figure 51).
Figure 51. Profiles of key informants interviewed during Round 11
40%
16%
Members of a civil society
association/organization
15%
13%
Representative of displaced Person with a key profession Member of CASEC/ASEC
persons
in the community (teacher,
doctor, nurse, etc.)
INTERNATIONAL ORGANIZATION FOR MIGRATIONS
Website: https://dtm.iom.int/haiti
Contact: dtmhaiti@iom.int
6%
4%
3%
2%
Civil protection officer
Religious leader
Other
Mayors
26
This map is for illustration purposes only. Names and boundaries on this map do not imply official
endorsement or acceptance by IOM.
Due to rounding, some percentages may not total 100.
�The following citation is required when using data and information included in this report: "International
Organization for Migration (IOM), Round 11 - September 2025, Assessment of the Displacement
Situation in Haiti. IOM Haiti"
The views expressed in this report are those of the authors and do not necessarily reflect those of the
International Organization for Migration (IOM). IOM does not pronounce on the legal status of any
country, territory, city, or area, or of its authorities, or on its frontiers or boundaries. For more
information on the terms and conditions of DTM reports and information products, please visit:
https://dtm.iom.int/terms-and-conditions.
Disclaimer : This publication was co-funded by the European Union. Its contents are the sole responsibility
of IOM and do not necessarily reflect the views of the European Union.
Copyright : © IOM 2025 Licensed to the European Union under conditions
DTM.IOM.INT/Haiti
dtmhaiti@iom.int
September 2025
�