Extracted text from the original document for search indexing.
Displacement situation
in Haiti – Round 8
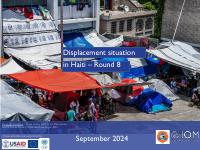
Photo de couverture : A site hosting IDPs in the Metropolitan
Area of Port-au-Prince © Olivier Ambroise, August 2024
These activities are supported by :
September 2024
�CONTENT
OVERVIEW OF KEY RESULTS ........................................................................................................................................................................................................ 3
AGE AND SEX DISAGGREGATION ............................................................................................................................................................................................ 4
INTERNALLY DISPLACED PERSONS
HOSTING OF IDPs ....................................................................................................................................................................................................... 5
IDPs’ PLACE OF ORIGIN............................................................................................................................................................................................. 7
REASONS AND PERIOD OF DISPLACEMENT....................................................................................................................................... 8
FOCUS ON THE METROPOLITAN AREA OF PORT-AU-PRINCE (MAPAP).................................................................. 9
FOCUS ON MUNICIPALITIES OF THE WEST OUT OF MAPAP............................................................................................ 13
FOCUS ON THE GREAT SOUTH.................................................................................................................................................................... 14
FOCUS ON THE CENTRE ..................................................................................................................................................................................... 16
FOCUS ON ARTIBONITE
................................................................................................................................................................................... 17
FOCUS ON THE GREAT NOR ......................................................................................................................................................................... 18
RETURNEES FORMERLY IDPs
............................................................................................................................................................................................... 20
�HAITI – MOBILITY TRACKING
Displacement situation in Haiti – September 2024
OVERVIEW OF KEY RESULTS
This report aims to provide a holistic view of the internal displacement situation in Haiti. The Directorate General of Civil
Protection (DGPC) and the IOM’s Displacement Tracking Matrix (DTM) have been conducting periodic assessments of
locations hosting displaced populations since August 2022. Data is collected through direct observations as well as
interviews with key informants at the lowest administrative level, which is the neighborhood in the Metropolitan Area of
Port-au-Prince (MAPAP) and the communal section outside the MAPAP.
Data collection:
01 August – 04 September 2024
Publication : 22 September 2024
1,042
702,973
Internally Displaced
Persons
+22%
✓ A slight decrease (6%) in the number of IDPs was observed in the MAPAP, reflecting the continuation of displacement
from the capital to provinces but in smaller proportions compared to the period of March-April 2024. Returns of some
IDPs was also observed, in particular in certain neighborhoods of the municipality of Cité Soleil (see section on
returnees).
of IDPs in
host families /
out of sites
Increase in the number of IDPs
compared to Round 6
117
in sites
sites
95 in MAPAP (1 less compared to Round 7)
22 in province (+4 compared to Round 7)
54%
✓ Provinces host 75% of the country's IDPs. In particular, the Great South (departments of South, Grande'Anse, SouthEast and Nippes) hosts almost half of all IDPs: 45% of the country's IDPs are hosted in these 4 departments.
✓ 65,535 returnees formerly IDPs were identified, particularly in the commune of Cité Soleil where a 151% increase in
the number of returnees was observed. It should be noted that for the moment these returns remain very fragile and are
not sustainable, particularly in the MAPAP. Indeed, returnees are often displaced again following new attacks in their
return area: in the MAPAP, 52% of IDPs have already been displaced more than once and these repeated movements
include new displacements after having returned home (see the report on displacement dynamics for more details).
170,255
Displaced households
17%
83%
✓ The MAPAP currently hosts a quarter of the country's IDPs, compared to about a third during the previous Round
(25% in Round 8 vs 32% in Round 7).
✓ At the national level, the majority of IDPs are hosted in host families/out of sites: 83% (vs 17% in sites). However, in
the MAPAP the majority of IDPs reside in sites (63% in sites vs. 37% in host families/out of sites), while in provinces the
opposite is true (98% in host families/out of sites vs. 2% in sites).
interviewed key informants
Internally Displaced Persons (IDPs)
✓ The last round of these assessments (Round 7 – published in June 2024) had indicated that 578,074 people were
internally displaced in Haiti. This new round indicates the presence of 702,973 Internally Displaced Persons (IDPs), almost
22% more than in Round 7. The armed attacks in the municipality of Gressier (located in the West department, outside
the MAPAP) are the main reason for this increase; this municipality has been almost emptied of its population following
these attacks and has become the second municipality of origin for IDPs in the country whereas it was in 5th position
during Round 7.
✓ The West Department, particularly the MAPAP, is the place of origin of the vast majority of IDPs in all departments.
The only exception is Artibonite, where 56% of IDPs fled from areas within the same department..
3,688
assessed locations
52%
of IDPs are women
(adults and minors)
of IDPs are children
IDPs’ period of displacement
<1%
4%
4%
27%
65%
Before
2021
2021
2022
2023
2024
Returnees formerly IDPs
65,535
15,980
Returned persons Returned households
INTERNATIONAL ORGANIZATION FOR MIGRATIONS
Website: https://dtm.iom.int/haiti
Contact: dtmhaiti@iom.int
3
31% more than
in Round 7
The following citation is required when using the data and information included in this report: “International Organization for
Migration (IOM), September 2024, DTM Assessment of the displacement situation in Haiti. IOM Haiti. For more information on terms
and conditions for DTM reports and information products, please see: https://dtm.iom.int/terms-and-conditions.
�HAITI – MOBILITY TRACKING
Displacement situation in Haiti – September 2024
Data collection:
01 August – 04 September 2024
Publication : 22 September 2024
IDPs’ AGE AND SEX DISAGGREGATION
RETURNEES’ AGE AND SEX DISAGGREGATION
Figure 1. IDPs’ age and sex disaggregation
Figure 2. Returnees’ age and sex disaggregation
60+
5% 4%
60+
18 - 59
21%
12 - 17
6 - 11
1-5
<1
Women
(54%)
18%
10%
9%
8%
7%
6%
5%
18 - 59
5% 4%
20%
12 - 17
9%
8%
7%
6%
1-5
7%
6%
<1
6% 5%
6 - 11
Men
(46%)
4% 3%
17%
Women
(54%)
Men
(46%)
More than half of all IDPs (54%) are women (adults and minors) and 52% are children. A similar distribution is observed among returnees, but children represent a
slightly higher proportion (54%).
INTERNATIONAL ORGANIZATION FOR MIGRATIONS
Website: https://dtm.iom.int/haiti
Contact: dtmhaiti@iom.int
4
The following citation is required when using the data and information included in this report: “International Organization for
Migration (IOM), September 2024, DTM Assessment of the displacement situation in Haiti. IOM Haiti. For more information on terms
and conditions for DTM reports and information products, please see: https://dtm.iom.int/terms-and-conditions.
�HAITI – MOBILITY TRACKING
Data collection:
01 August – 04 September 2024
Publication : 22 September 2024
Displacement situation in Haiti – September 2024
HOSTING OF IDPs
Figure 4. Number and proportion of IDPs in their host regions
Figure 3. Host departments of IDPs
Displaced
households
Host regions
MAPAP
Out of MAPAP
South
South-East
Great South
(45%)
Grande'Anse
Nippes
Centre (7%)
Centre
Artibonite
Artibonite
(6%)
North
Great North
North-West
(7%)
North-East
TOTAL
West (35%)
# of IDPs
% of IDPs
42,717
16,742
27,441
21,368
16,399
10,432
12,373
173,156
69,519
116,602
82,366
79,722
36,510
52,045
10,629
9,074
2,447
633
170,255
44,566
35,316
10,625
2,546
702,973
25%
10%
17%
12%
11%
5%
7%
6%
5%
2%
0.4%
100%
Figure 5. Proportion of IDPs in host families and sites per host region
Host regions
MAPAP
The majority of IDPs are hosted in provinces* (75% compared to 25% in the MAPAP). The
West
Out
of MAPAP
4 departments of the Great South (South, Nippes, Grande’Anse and South-East) host nearly
South
half of the country’s IDPs (45%).
South-East
Great
The vast majority of IDPs in provinces are hosted by host families (98%). The remaining 2%
South
Grande'Anse
are hosted in 22 sites located in the West outside the MAPAP (8 sites in the municipality of
Nippes
Léogâne, with 6,283 IDPs; 3 sites in Arcahaie with 1,110 IDPs; 3 sites in Ganthier following
Centre
Centre
armed attacks, hosting 810 IDPs); 3 sites are located in Artibonite with 245 people, 3 in
Nippes with 245 people; and 1 site (with 223 people) in the Northeast, created following Artibonite Artibonite
the displacement of people due to a tornado in May 2024. In addition, 95 sites, hosting
North
109,545 IDPs, have been identified in the MAPAP.
Great
North
* The term "province" refers to all areas of the country outside MAPAP
INTERNATIONAL ORGANIZATION FOR MIGRATIONS
Website: https://dtm.iom.int/haiti
Contact: dtmhaiti@iom.int
5
North-West
North-East
TOTAL
Total of
IDPs
IDPs in host
IDPs in sites
families
# of sites
173,156
69,519
116,602
82,366
79,722
36,510
52,045
37%
62%
100%
100%
100%
99%
100%
63%
38%
0%
0%
0%
1%
0%
95
15
0
0
0
3
0
44,566
35,316
10,625
2,546
702,973
99%
1%
3
100%
98%
100%
83%
0%
2%
0%
17%
0
1
0
117
The following citation is required when using the data and information included in this report: “International Organization for
Migration (IOM), September 2024, DTM Assessment of the displacement situation in Haiti. IOM Haiti. For more information on terms
and conditions for DTM reports and information products, please see: https://dtm.iom.int/terms-and-conditions.
�HAITI – MOBILITY TRACKING
Displacement situation in Haiti – September 2024
Figure 6. IDPs by municipality section (admin 2)
Data collection:
01 August – 04 September 2024
Publication : 22 September 2024
Figure 8. Main IDPs’ hosting municipalities
Delmas
Port-au-Prince
Municipality
Department
# of IDPs
% of IDPs
Port-au-Prince
West
98,412
14%
Delmas
West
48,615
7%
Les Cayes
South
36,813
5%
Jacmel
South-East
34,977
5%
Jérémie
Grande'Anse
19,205
3%
Cap-Haïtien
North
15,840
2%
Léogâne
West
14,977
2%
The municipality of Port-au-Prince is the municipality which hosts the most IDPs in
the country, with more than a tenth of the IDPs hosted there. Almost all IDPs in
Port-au-Prince were displaced from various neighborhoods of the same municipality.
Figure 7. IDPs by municipality section (admin 3)
Furthermore, it should be noted that this municipality is also the leading municipality
of origin for IDPs in the country: nearly a third of IDPs in the country originated
from neighborhoods of Port-au-Prince (see the following page for more details on
places of origin).
In provinces, the 3 major cities of the Greath South (Les Cayes, Jacmel and Jérémie)
host 13% of the country's IDPs.
INTERNATIONAL ORGANIZATION FOR MIGRATIONS
Website: https://dtm.iom.int/haiti
Contact: dtmhaiti@iom.int
6
La citation
suivante est
requise
lors de when
l’utilisation
des data
données
et informations
incluses
dans
ce rapport
: « Organisation
Internationale
The following
citation
is required
using the
and information
included
in this
report:
“International
Organization
for
pour les
Migrations
(OIM),
septembre
2024,
Evaluations
de of
la the
situation
de déplacement
Pour
plusinformation
d'informations
Migration
(IOM),
September
2024,
DTM
Assessment
displacement
situationen
in Haïti.
Haiti. OIM
IOM Haïti
Haiti.»For
more
on sur
terms
les termes
conditions
rapports
des produits
d'informations
DTM,
https://dtm.iom.int/terms-and-conditions
and et
conditions
for des
DTM
reportsetand
information products,
please
see:veuillez consulter :
https://dtm.iom.int/terms-and-conditions.
�HAITI – MOBILITY TRACKING
Displacement situation in Haiti – September 2024
Data collection:
01 August – 04 September 2024
Publication : 22 September 2024
IDPs’ PLACE OF ORIGIN
Figure 9. IDPs by department of provenance (admin 1)
Figure 10. IDPs by municipality of origin (admin 2)
Figure 11. IDPs’ place of origin
The West Department is the department of origin for almost all IDPs (96%),
while 3% came from the Artibonite Department.
31%
Ouest
West (96%)
(3%)
Artibonite
INTERNATIONAL ORGANIZATION FOR MIGRATIONS
Website: https://dtm.iom.int/haiti
Contact: dtmhaiti@iom.int
7
Other
Autre
Other
Autre
Verrettes
Petite Rivière de…
Other
Autre
Tabarre
Cité Soleil
Arcahaie
Ganthier
Cabaret
Pétion-Ville
6% 3% 3%
2% 2% 1% 1% 1% 1% 1% 1% 1%
Delmas
12%
Carrefour
Croix-Des-Bouquets
Gressier
Port-au-Prince
19% 16%
The epicenter of the violence is the West Department, in particular the capital of
the country, the MAPAP, which is the place of origin for more than 70% of all
IDPs in the country, in particular its commune of Port-au-Prince, from which
31% of all IDPs originated.
However, it should be noted that in recent weeks, the violence increasingly
spread to areas surrounding the MAPAP. Armed violence in June-July 2024 in the
municipality of Gressier pushed almost all of its population to move, Gressier
becoming the second municipality of origin for IDPs in the country.
(1%)
Autre
Other
La citation
suivante est
requise
lors de when
l’utilisation
des data
données
et informations
incluses
dans
ce rapport
: « Organisation
Internationale
The following
citation
is required
using the
and information
included
in this
report:
“International
Organization
for
pour les
Migrations
(OIM),
septembre
2024,
Evaluations
de of
la the
situation
de déplacement
Pour
plusinformation
d'informations
Migration
(IOM),
September
2024,
DTM
Assessment
displacement
situationen
in Haïti.
Haiti. OIM
IOM Haïti
Haiti.»For
more
on sur
terms
les termes
conditions
rapports
des produits
d'informations
DTM,
https://dtm.iom.int/terms-and-conditions
and et
conditions
for des
DTM
reportsetand
information products,
please
see:veuillez consulter :
https://dtm.iom.int/terms-and-conditions.
�HAITI – MOBILITY TRACKING
Displacement situation in Haiti – September 2024
PERIOD OF DISPLACEMENT
REASONS FOR DISPLACEMENT
Figure 12. Period of first displacement
Figure 13. Reasons for displacement
65%
27%
<1%
Avant
2021
Before
4%
2021
Data collection:
01 August – 04 September 2024
Publication : 22 September 2024
IDPs’ reasons for displacement
%
Attacks / Violence
99%
Preventive displacement / Fear
0.7%
Natural disaster
0,3%
4%
2022
2023
2024
2021
It should be noted that the period of first displacement is for persons still
displaced to date, without taking into account persons who have since
returned home. As such, it does not present the overall evolution or the
cumulative number of displacements for a given year, but rather indicates
the periods during which began the displacement of persons currently
displaced.
Violence-related reasons were the reason for displacement for almost
all IDPs in Haiti. Only 0.3% of those currently displaced were displaced
due to a natural disaster.
The year 2024 constitutes the period of displacement for the majority of
persons who are currently displaced, indicating a growing deterioration
in the security situation during this year.
INTERNATIONAL
ORGANIZATIONPOUR
FOR MIGRATIONS
ORGANISATION
INTERNATIONALE
LES MIGRATIONS
Website:
https://dtm.iom.int/haiti
Site
web: https://dtm.iom.int/haiti
Contact:
dtmhaiti@iom.int
Contact:
dtmhaiti@iom.int
8
The following citation is required when using the data and information included in this report: “International Organization for
Migration (IOM), September 2024, DTM Assessment of the displacement situation in Haiti. IOM Haiti. For more information on terms
and conditions for DTM reports and information products, please see: https://dtm.iom.int/terms-and-conditions.
�HAITI – MOBILITY TRACKING
Displacement situation in Haiti – September 2024
FOCUS ON THE METROPOLITAN AREA OF PORT-AU-PRINCE
42,757
173,156
Figure 14. Evolution of the number of IDPs in the MAPAP since 2022
Round 8
(September 2024)
Round 7
(June 2024)
-6%
Variation in the number of IDPs
compared to Round 7
37%
63%
of IDPs in host families
/out of sites
Round 6
(March 2024)
compared
95 (+1to Round
7)
in sites
Round 5
sites
(Nov 2023)
Round 4
(June 2023)
Figure 15. IDPs by host municipality in MAPAP
Municipalities
# of IDPs
(March 2023)
% of IDPs
Port-au-Prince
23,176
98,412
57%
Delmas
12,994
48,615
28%
Carrefour
2,105
8,322
5%
Tabarre
1,448
4,908
3%
Pétion-Ville
Croix-DesBouquets
1,019
4,596
3%
1,000
4,252
2%
Cité Soleil
1,015
4,051
2%
42,757
173,156
100%
TOTAL
+15%
184,789
Increased armed attacks by a coalition of different MAPAP gang groups and the resulting
widespread insecurity, pushing thousands of people to flee MAPAP to the provinces and others
to move between different neighborhoods within MAPAP.
146 584
+15% 160,550
After a relative decrease in security incidents in late 2023, the beginning of 2024 saw a significant increase in
these incidents, forcing more and more people to flee their homes. In particular, the attacks in Solino and
Gabelliste in January 2024 (see ETT 34.1), in Carrefour in January 2024 (ETT 35), in Pétion-ville, Port-au-Prince
and Cité soleil in January 2024 (ETT 36.1), in Carrefour, Cité Soleil and Tabarre in February 2024 (ETT 37.1).
+7% 139,853
143 209
The increase is mainly due to armed attacks that occurred in the Carrefour-Feuilles and SavanesPistaches neighborhoods in August 2023 (ETT 22.5)
+2% 130,884
Slight increase mainly due to flooding in early June 2023 (see ETT 18.3)
Round 3
Displaced
households
-6% 173,156
Continual departure of populations to provinces but also certain returns of IDPs observed in
certain areas of the MAPAP, notably in certain neighborhoods of Cité Soleil
Displaced households
Internally Displaced
Persons
Data collection:
01 August – 04 September 2024
Publication : 22 September 2024
INTERNATIONAL ORGANIZATION FOR MIGRATIONS
Website: https://dtm.iom.int/haiti
Contact: dtmhaiti@iom.int
9
Round 2
(Nov 2022)
Round 1
(August 2022)
-18% 127,977
This decrease was mainly due to a relative drop in security incidents in MAPAP at the end
of 2022 and the beginning of 2023. Thus, nearly 15,000 IDPs had returned home
between the two rounds.
+77% 155,166
This significant increase was due to the deterioration of the general situation in MAPAP
following sometimes violent social protest movements, particularly due to the increase
in the price of fuel.
87,895
More than 173,000 people are internally displaced in the MAPAP, 6% less than in Round 7. The
municipality of Port-au-Prince hosts the majority of IDPs in the MAPAP (57%), followed by Delmas
(28%). Unlike the situation in provinces, in the MAPAP the majority of IDPs (63%) are hosted in sites.
95 sites have been identified in the MAPAP hosting 109,540 IDPs (3% less than in Round 7). The
slight decrease in IDPs’ number can be explained by the continued departures of people leaving the
capital to go to provinces and by the return of IDPs in certain areas of the MAPAP, particularly in
Cité Soleil (see page 20 for more details).
La citation
suivante est
requise
lors de when
l’utilisation
des data
données
et informations
incluses
dans
ce rapport
: « Organisation
Internationale
The following
citation
is required
using the
and information
included
in this
report:
“International
Organization
for
pour les
Migrations
(OIM),
septembre
2024,
Evaluations
de of
la the
situation
de déplacement
Pour
plusinformation
d'informations
Migration
(IOM),
September
2024,
DTM
Assessment
displacement
situationen
in Haïti.
Haiti. OIM
IOM Haïti
Haiti.»For
more
on sur
terms
les termes
conditions
rapports
des produits
d'informations
DTM,
https://dtm.iom.int/terms-and-conditions
and et
conditions
for des
DTM
reportsetand
information products,
please
see:veuillez consulter :
https://dtm.iom.int/terms-and-conditions.
�HAITI – MOBILITY TRACKING
Displacement situation in Haiti – September 2024
Figure 16. IDPs in sites in the MAPAP
Data collection:
01 August – 04 September 2024
Publication : 22 September 2024
On average, sites in the MAPAP host 1,153 IDPs. Most sites in the
MAPAP are located in the municipality of Port-au-Prince (60 of the 95
sites are located in this municipality). 89% of all IDPs in this municipality
are hosted in sites, and 11% are in host families/out of sites (see Figure
19 on the next page).
When significant displacement started to happen in the MAPAP in
2022, most IDPs were hosted in host families: by the end of 2022, only
a quarter of all IDPs were in sites. A year later, by the end of 2023, the
situation had reversed, with the majority of IDPs residing in sites (58%).
This trend continued in 2024 and currently, more than 6 out of 10
IDPs reside in sites (63%) (see Figure 17).
Figure 17. Evolution of the proportions of IDPs in host families vs in sites from 2022 to 2024
96
86
75%
75%
62%
50
51
25%
Round 1
(August
2022)
Round 2
(November
2022)
58
95
61%
61%
63%
55%
36
25%
73
58%
45%
38%
Round 3
(March
2023)
42%
Round 4
Round 5
(June 2023) (November
2023)
IDPs in host families/out of sites
37%
39%
Round 6
(March
2024)
39%
The growing insecurity restricting possibilities to seek refuge with
relatives, the lack of resources of host families to accommodate IDPs
for a relatively long period of time, and the deterioration of social
cohesion, are the main reasons for this. Surveys carried out by the
DTM among displaced households and host communities in the
country have shown that tensions and conflicts between IDPs and host
communities are more frequent in the MAPAP than in the provinces.
IDPs in sites represent the category of households that most often
reports the existence of tensions or conflicts with host communities.
(see the report on displacement dynamics for more details).
Round 7
Round 8
(June 2024) (September
2024)
IDPs in sites
# of sites
INTERNATIONAL
ORGANIZATIONPOUR
FOR LES
MIGRATIONS
ORGANISATION
INTERNATIONALE
MIGRATIONS
Website:
https://dtm.iom.int/haiti
Site web:
https://dtm.iom.int/haiti
Contact:
dtmhaiti@iom.int
Contact:
dtmhaiti@iom.int
10
The following citation is required when using the data and information included in this report: “International Organization for
Migration (IOM), September 2024, DTM Assessment of the displacement situation in Haiti. IOM Haiti. For more information on terms
and conditions for DTM reports and information products, please see: https://dtm.iom.int/terms-and-conditions.
�HAITI – MOBILITY TRACKING
Displacement situation in Haiti – September 2024
Data collection:
01 August – 04 September 2024
Publication : 22 September 2024
Figure 19. IDPs in host families vs. in sites by host municipality in the
MAPAP
Figure 18. Displacement situation in the neighborhoods of the MAPAP
Municipalities # of IDPs
INTERNATIONAL
ORGANIZATION FOR
MIGRATIONS
ORGANISATION
INTERNATIONALE
POUR LES
MIGRATIONS
Website:
https://dtm.iom.int/haiti
Site
web: https://dtm.iom.int/haiti
Contact:dtmhaiti@iom.int
dtmhaiti@iom.int
Contact:
11
IDPs in host
families
IDPs in
sites
# of sites
Port-au-Prince
98,412
11%
89%
60
Delmas
48,615
71%
29%
16
Carrefour
8,322
75%
25%
6
Tabarre
4,908
50%
50%
4
Pétion-Ville
Croix-DesBouquets
4,596
83%
17%
1
4,252
100%
0%
0
Cité Soleil
4,051
34%
66%
8
TOTAL
173,156
37%
63%
95
The following citation is required when using the data and information included in this report: “International Organization for
Migration (IOM), September 2024, DTM Assessment of the displacement situation in Haiti. IOM Haiti. For more information on terms
and conditions for DTM reports and information products, please see: https://dtm.iom.int/terms-and-conditions.
�HAITI – MOBILITY TRACKING
Displacement situation in Haiti – September 2024
Data collection:
01 August – 04 September 2024
Publication : 22 September 2024
Figure 21. IDPs by type of site in MAPAP
Figure 20. Types of site in MAPAP
Types of sites
# of sites
# of IDPs
% of IDPs
Schools
34
55,843
51%
Church /Temple
21
18,429
17%
Covered and fenced area
17
17,516
16%
Uncovered and fenced area
12
8,937
8%
Uncovered and unfenced space
11
8,815
8%
95
109,540
100%
TOTAL
Half of all IDPs (51%) in the MAPAP are hosted in schools. In total, there are
34 schools hosting nearly 56,000 people, 10% less than in Round 7.
INTERNATIONAL
ORGANIZATION FOR
MIGRATIONS
ORGANISATION
INTERNATIONALE
POUR LES
MIGRATIONS
Website:
https://dtm.iom.int/haiti
Site
web: https://dtm.iom.int/haiti
Contact:dtmhaiti@iom.int
dtmhaiti@iom.int
Contact:
12
The following citation is required when using the data and information included in this report: “International Organization for
Migration (IOM), September 2024, DTM Assessment of the displacement situation in Haiti. IOM Haiti. For more information on terms
and conditions for DTM reports and information products, please see: https://dtm.iom.int/terms-and-conditions.
�HAITI – MOBILITY TRACKING
Displacement situation in Haiti – September 2024
Data collection:
01 August – 04 September 2024
Publication : 22 September 2024
Figure 23. IDPs’ host locations in West department, outside MAPAP
FOCUS ON MUNICIPALITIES IN THE WEST, OUTSIDE MAPAP
16,742
69,519
Displaced households
Internally Displaced
Persons
Variation in the number of IDPs
+164% compared to Round 7
88%
of IDPs in host families
/out of sites
15
12%
sites
in sites
(6 sites
more than
in round 7)
Figure 22. IDPs per host municipality in the West, outside MAPAP
Municipalities
Displaced
# of IDPs % of IDPs
households
# of sites
Léogâne
3,972
14,977
22%
8 (hosting
6,283 IDPs)
Arcahaie
2,615
12,320
18%
3 (1,110 IDPs)
Ganthier
3,430
10,582
15%
3 (810 IDPs)
Cabaret
2,531
10,363
15%
1 (33 IDPs)
Grand-Goâve
1,376
8,198
12%
0
Petit-Goâve
1,645
7,492
11%
0
Anse à Galets
355
1,722
2%
0
Pointe à Raquette
342
1,453
2%
0
Nearly 70,000 people are internally displaced in areas located in the West department, outside
the MAPAP. This is mainly due to the increased armed violence in the municipality of Gressier
during the months of June and July 2024, which became the main municipality of origin of IDPs
located in the West, outside the MAPAP. Municipalities located towards South-East of the
MAPAP constitute an important hosting area for people who fled Gressier (these are Léogâne,
Grand-Goâve and Petit-Goâve). The armed violence in the commune of Ganthier between July
and August 2024 also caused significant displacement in this commune, and 3 spontaneous sites
were created there.
Carrefour
233
1,108
2%
0
Figure 24. Municipalities of origin of IDPs located in the West, outside MAPAP
Others
243
1,304
2%
0
TOTAL
16,742
69,519
100%
15
37%
Gressier
INTERNATIONAL
ORGANIZATIONPOUR
FOR MIGRATIONS
ORGANISATION
INTERNATIONALE
LES MIGRATIONS
https://dtm.iom.int/haiti
SiteWebsite:
web: https://dtm.iom.int/haiti
Contact:
dtmhaiti@iom.int
Contact:
dtmhaiti@iom.int
13
19%
Cabaret
Arcahaie
17%
Ganthier
15%
6% 6%
Carrefour
Autres
Other
The following citation is required when using the data and information included in this report: “International Organization for
Migration (IOM), September 2024, DTM Assessment of the displacement situation in Haiti. IOM Haiti. For more information on terms
and conditions for DTM reports and information products, please see: https://dtm.iom.int/terms-and-conditions.
�HAITI – SUIVI
DEMOBILITY
MOUVEMENT
DES POPULATIONS
HAITI –
TRACKING
Displacement
Situation
desituation
déplacement
in Haiti
en –Haïti –
September
Juin 2024
2024
FOCUS ON THE GREAT SOUTH
75,640
315,200
Displaced households
Internally Displaced
Persons
+17%
Increase in the number of IDPs
compared to Round 7
99.9%
of IDPs in host families
/out of sites
0.1%
in sites
3
sites
(same as in
round 7)
Data collection:
01 August – 04
JuinSeptember
2024 2024
Publication : 22 September 2024
The number of IDPs in the four departments of the Great South increased by 17% compared to
Round 7. This increase is due to the displacement of people who fled the municipality of
Gressier, which has become, along with Port-au-Prince, the main place of origin for IDPs in the
Great South, particularly those living in the Southeast (see Figures 34 and 35).
This region is the leading host region for IDPs in the country, hosting nearly half of the country's
IDPs (45%). Among the four departments in this region, the South is the leading host
department for IDPs: 116,602 IDPs are located in this department, representing 37% of IDPs in
the Great South and 17% of IDPs in the country. Then the South-East department with 82,366
IDPs (26% of IDPs in the Great South and 12% of the country), Grande’Anse hosting 79,722
IDPs (25% of the Great South and 11% of the country) and Nippes with 36,510 IDPs (12% of
the Great South and 5% of the country).
Figure 34. Municipalities of origin for IDPs living in the Great South
33%
Figure 33. IDPs’ hosting locations in the Great South
Gressier
32%
Port-au-Prince
22%
Carrefour
10%
3%
Croix-Des-Bouquets
Autres
Other
Figure 35. Municipalities of origin for IDPs, by
hosting department
6%
5%
1%
21%
7%
20%
61%
41%
51%
16%
Autres
Other
Carrefour
Gressier
INTERNATIONAL
ORGANIZATIONPOUR
FOR MIGRATIONS
ORGANISATION
INTERNATIONALE
LES MIGRATIONS
https://dtm.iom.int/haiti
SiteWebsite:
web: https://dtm.iom.int/haiti
Contact:
dtmhaiti@iom.int
Contact:
dtmhaiti@iom.int
14
9%
30%
30%
7%
9%
54%
32%
Croix-Des-Bouquets
Port-au-Prince
The following citation is required when using the data and information included in this report: “International Organization for
Migration (IOM), September 2024, DTM Assessment of the displacement situation in Haiti. IOM Haiti. For more information on terms
and conditions for DTM reports and information products, please see: https://dtm.iom.int/terms-and-conditions.
�HAITI – SUIVI
DEMOBILITY
MOUVEMENT
DES POPULATIONS
HAITI –
TRACKING
Displacement
Situation
desituation
déplacement
in Haiti
en –Haïti –
September
Juin 2024
2024
Figure 36. Main IDPs’ hosting municipalities in the Great South
Municipalities
Department
# of IDPs
% of IDPs of the
Great South
Les Cayes
South
36 813
12%
Jacmel
South-East
34 977
11%
Jérémie
Grande'Anse
19 205
6%
Anse d'Hainault
Grande'Anse
12 130
4%
Bainet
South-East
9 789
3%
Abricots
Grande'Anse
9 250
3%
Cavaillon
South
8 685
3%
Chambellan
Grande'Anse
8 500
3%
Torbeck
South
8 405
3%
Corail
Aquin
Grande'Anse
South
8 400
8 296
3%
3%
Data collection:
01 August – 04
JuinSeptember
2024 2024
Publication : 22 September 2024
Les Cayes, Jacmel and Jérémie are the top three hosting municipalities in the
Great South, hosting nearly a third of all IDPs (29%) living in the Great South.
Compared to Round 7, the South-East and Grande’Anse are the departments
that have seen the most significant increase in the number of IDPs: 33% more in
the South-East and 30% in Grande’Anse (Figure 37).
These increases were particularly notable in the municipalities of Belle Anse
(+211%), Roche à Bateau (+197%), Bonbon (+174%) and La Vallée (+157%)
(see Figure 38).
Figure 37. Variation in the number of IDPs in the Great South, between Round 7 and
Round 8
Figure 38. Municipalities experienced largest increases in the number of IDPs hosted
between Round 7 and Round 8
# of IDPs in
Round 8
# of IDPs in
Round 7
% of variation
Municipalities
Department
# of IDPs in
Round 8
# of IDPs in
Round 7
% de variation
South
116,602
114,627
+2%
Belle Anse
South-East
5 458
1 755
+211%
South-East
82,366
61,831
+33%
Roche à Bateau
South
7 596
2 555
+197%
Grande'Anse
79,722
61,428
+30%
Bonbon
Grande'Anse
1 920
700
+174%
Nippes
36,510
30,566
+19%
La Vallée
South-East
4 024
1 566
+157%
GREAT SOUTH
315,200
268,452
+17%
Anse d'Hainault
Grande'Anse
12 130
5 200
+133%
Marigot
South-East
4 060
1 744
+133%
Grand-Boucan
Nippes
480
207
+132%
Abricots
Grande'Anse
9 250
4 252
+118%
Anse-à-Pître
South-East
7 500
3 750
+100%
Department
INTERNATIONAL
ORGANIZATION
FOR MIGRATIONS
ORGANISATION
INTERNATIONALE
POUR
LES MIGRATIONS
https://dtm.iom.int/haiti
SiteWebsite:
web: https://dtm.iom.int/haiti
Contact:
dtmhaiti@iom.int
Contact:
dtmhaiti@iom.int
15
The following citation is required when using the data and information included in this report: “International Organization for
Migration (IOM), September 2024, DTM Assessment of the displacement situation in Haiti. IOM Haiti. For more information on terms
and conditions for DTM reports and information products, please see: https://dtm.iom.int/terms-and-conditions.
�HAITI – MOBILITY TRACKING
Displacement situation in Haiti – September 2024
Figure 39. IDPs’ host locations in the Centre
FOCUS ON CENTRE DEPARTMENT
12,373
52,045
Displaced households
Internally Displaced
Persons
+28%
Data collection:
01 August – 04 September 2024
Publication : 22 September 2024
Increase in the number of IDPs
compared to Round 7
100%
of IDPs in host families
/out of sites
Figure 40. IDPs by hosting municipalities in the Centre
Displaced
households
# of IDPs
% of IDPs
Belladère
2,774
11,300
22%
Hinche
Boucan Carré
Lascahobas
1,749
1,685
1,400
7,412
7,400
6,000
14%
14%
12%
Thomonde
1,258
5,377
10%
Thomassique
820
3,700
7%
Mirebalais
885
3,700
7%
Maïssade
530
2,667
5%
Saut d'Eau
568
2,064
4%
Cerca Carvajal
400
1,800
3%
Savanette
157
321
1%
Cerca La Source
147
304
1%
85%
5%
TOTAL
12,373
52,045
100%
Croix-Des-Bouquets
Port-au-Prince
Thomazeau
Delmas
Carrefour
Cabaret
Municipalities
Belladère is the main hosting municipality for IDPs in the Centre, with almost a quarter of
IDPs in Centre department living there (22%). The municipalities of Belladère and Lascahobas
are the two that have experienced the most significant increase in number of IDPs hosted,
compared to Round 7 (+53% in each of these municipalities).
All IDPs in the Centre came from the West department, particularly from the neighboring
municipality of Croix-des-Bouquets: almost 9 out of 10 IDPs who are hosted in the Centre
(85%) came from this municipality, which is also one of the main places of origin for IDPs in
the country due to the insecurity situation that prevails there.
Figure 41. Municipalities of origin for IDPs living in Centre
INTERNATIONAL
ORGANIZATIONPOUR
FOR MIGRATIONS
ORGANISATION
INTERNATIONALE
LES MIGRATIONS
Website:
https://dtm.iom.int/haiti
Site web:
https://dtm.iom.int/haiti
Contact:
dtmhaiti@iom.int
Contact:
dtmhaiti@iom.int
16
3%
3%
3%
1%
The following citation is required when using the data and information included in this report: “International Organization for
Migration (IOM), September 2024, DTM Assessment of the displacement situation in Haiti. IOM Haiti. For more information on terms
and conditions for DTM reports and information products, please see: https://dtm.iom.int/terms-and-conditions.
�HAITI – MOBILITY TRACKING
Data collection:
01 August – 04 September 2024
Publication : 22 September 2024
Displacement situation in Haiti – September 2024
Figure 42 IDPs’ hosting locations in Artibonite
FOCUS ON ARTIBONITE DEPARTMENT
10,629
44,566
Displaced households
Internally Displaced
Persons
+28%
Increase in the number of IDPs
compared to Round 7
99.5%
of IDPs in host families
/out of sites
0.5%
3
in sites
sites
(2 sites less than
in round 7)
Figure 43. IDPs by hosting municipality in Artibonite
1,310
4,967
975 4,,749
827
3,556
958
2,532
522
1,916
592
1,822
263
1,738
267
1,068
225
1,000
154
748
112
560
40
120
17
80
10,629 44,566
11%
11%
8%
6%
4%
4%
4%
2%
2%
2%
1%
0%
0%
100%
Nearly 45,000 people are internally displaced in Artibonite (+28% compared to Round 7),
almost all of whom in host families. The municipalities of Verrettes and Saint-Marc host
almost half of those IDPs (44%). The municipalities of Terre Neuve and Petite Rivière are
those where the increase in the number of IDPs have been the most notable since Round 7
(+558% and 466% respectively). Artibonite is the only department in the country where the
majority of IDPs are not from the West. In this department, 56% of IDPs fled areas located
in the same department and 44% came from the West. The commune of Verrettes (in
particular the communal section of Liancourt) and that of Petite Rivière are the place of
origin for 42% of all IDPs living in Artibonite.
21%
1 (67 PDI)
5 (avec 495 PDI)
INTERNATIONAL
ORGANIZATION
FOR LES
MIGRATIONS
ORGANISATION
INTERNATIONALE
POUR
MIGRATIONS
https://dtm.iom.int/haiti
SiteWebsite:
web: https://dtm.iom.int/haiti
Contact:
dtmhaiti@iom.int
Contact:
dtmhaiti@iom.int
21%
Figure 44. Municipalities of origin for IDPs living in Artibointe
3%
3%
3%
5%
Artibonite (56%)
15%
8%
8%
7%
5%
1%
Delmas
Gonaïves
Gros Morne
Anse Rouge
Terre Neuve
Dessalines
Petite Rivière de l'Artibonite
Saint-Michel de l'Attalaye
Grande Saline
Marmelade
Ennery
La Chapelle
L'Estère
Desdunes
TOTAL
2 (accueillant 178
PDI)
Ganthier
20%
Gressier
9,048
Port-auPrince
2,028
Cabaret
Verrettes
Croix-DesBouquets
24%
Other
Autres
2,339 10,662
L'Estère
Saint-Marc
# of sites
Dessalines
% of
IDPs
Terre
Neuve
# of
IDPs
Petite
Rivière…
Displaced
households
Verrettes
Municipalities
Ouest (44%)
West
La citation
suivante citation
est requise
lors dewhen
l’utilisation
desdata
données
et informations
incluses
ce rapport
: « Organisation
Internationale
The following
is required
using the
and information
included
in thisdans
report:
“International
Organization
for
Migrations
(OIM),
septembre
deofla the
situation
de déplacement
Haïti. IOM
OIM Haïti
Pour
plusinformation
d'informations sur
Migration
(IOM),
September
2024,2024,
DTMEvaluations
Assessment
displacement
situation en
in Haiti.
Haiti. »For
more
terms
17 pour les
les termes
conditions
produits products,
d'informations
DTM,
https://dtm.iom.int/terms-and-conditions
and et
conditions
for des
DTMrapports
reports et
andes
information
please
see:veuillez consulter :
https://dtm.iom.int/terms-and-conditions.
�HAITI – MOBILITY TRACKING
Displacement situation in Haiti – September 2024
Data collection:
01 August – 04 September 2024
Publication : 22 September 2024
FOCUS ON THE GREAT NORTH
12,154
48,487
Displaced households
Internally Displaced
Persons
99.5%
of IDPs in host families
/out of sites
The Great North hosts 7% of the country’s IDPs. Almost all of these people are hosted in
host families/out of sites, except for 223 people residing in a site located in the NorthWest, who were displaced in May 2024 following a tornado.
0.5%
in site
as in
1 (same
round 7)
More than 9 out of 10 IDPs in the Great North came from the West, particularly from
municipalities of the MAPAP (Pétion-ville, Croix-des-Bouquets, Port-au-Prince, Delmas,
Carrefour and Cité Soleil) (see Figure 46).
site
Figure 46. Municipalities of origin for IDPs living
in the Great North
Other
Autres
Nord-Ouest (6.5%) (0.5%)
North-West
in the number of IDPs
+112% Increase
compared to Round 7
Figure 45. IDPs’ hosting locations in the Great North
Autres
0.5%
Anse-à-Foleur
0.5%
Bassin Bleu
2%
Saint-Louis du Nord
West
Ouest (93%)
Autres
1%
Gressier
3%
Cité Soleil
3%
Carrefour
8%
Delmas
8%
Port-au-Prince
22%
Croix-Des-Bouquets
23%
Pétion-Ville
INTERNATIONALINTERNATIONALE
ORGANIZATION FOR
MIGRATIONS
ORGANISATION
POUR
LES MIGRATIONS
Website:
https://dtm.iom.int/haiti
Site
web: https://dtm.iom.int/haiti
Contact: dtmhaiti@iom.int
dtmhaiti@iom.int
Contact:
4%
25%
La citation
suivante citation
est requise
lors dewhen
l’utilisation
desdata
données
et informations
incluses
ce rapport
: « Organisation
Internationale
The following
is required
using the
and information
included
in thisdans
report:
“International
Organization
for
Migrations
(OIM),
septembre
deofla the
situation
de déplacement
Haïti. IOM
OIM Haïti
Pour
plusinformation
d'informations sur
Migration
(IOM),
September
2024,2024,
DTMEvaluations
Assessment
displacement
situation en
in Haiti.
Haiti. »For
more
terms
18 pour les
les termes
conditions
produits products,
d'informations
DTM,
https://dtm.iom.int/terms-and-conditions
and et
conditions
for des
DTMrapports
reports et
andes
information
please
see:veuillez consulter :
https://dtm.iom.int/terms-and-conditions.
�HAITI – SUIVI
DEMOBILITY
MOUVEMENT
DES POPULATIONS
HAITI –
TRACKING
Displacement
Situation
desituation
déplacement
in Haiti
en –Haïti –
September
Juin 2024
2024
Figure 47. Top 11 IDPs’ hosting municipalities in the Great North
Municipalities
Department
# of IDPs
Cap Haïtien is the municipality that hosts the most IDPs in the Great North
with a third of all IDPs who are hosted there.
% of IDPs of the
Great North
Cap-Haïtien
North
15,840
33%
Plaisance
North
3,959
8%
Pilate
North
3,852
8%
Jean Rabel
North-West
3,576
7%
Limonade
Saint-Louis du
Nord
North
3,433
7%
North-West
2,301
5%
Pignon
North
1,450
3%
Quartier Morin
North
1,200
2%
Bassin Bleu
North-West
1,069
2%
Môle Saint Nicolas North-West
Acul du Nord
North
1,053
1,025
2%
2%
Figure 48. Variations in the number of IDPs in the Great North, between Round 7
and Round 8
Department
# of IDPs in
Round 8
# of IDPs in
Round 7
Data collection:
01 August – 04
JuinSeptember
2024 2024
Publication : 22 September 2024
The North department is the department that has experienced the greatest
increase in the number of IDPs compared to round 7 (an increase of 192%)
(figure 48).
This increase was particularly notable in the communes of Vallières (+864%),
Ranquitte (+679%), Baie de Henne (+548%) and Plaisance (+539%) (see
figure 49).
Figure 49. Top 10 municipalities that experienced the largest increase in number of
IDPs hosted between Round 7 and Round 8
% of variation
North
35,316
12,095
192%
North-East
2,546
2,478
3%
North-West
10,625
8,268
29%
GREAT NORTH
48,487
22,841
+112%
INTERNATIONAL
ORGANIZATION
FOR MIGRATIONS
ORGANISATION
INTERNATIONALE
POUR
LES MIGRATIONS
https://dtm.iom.int/haiti
SiteWebsite:
web: https://dtm.iom.int/haiti
Contact:
dtmhaiti@iom.int
Contact:
dtmhaiti@iom.int
# of IDPs in
Round 8
# of IDPs in
Round 7
Municipalities
Department
Vallières
Nord-East
212
22
+864%
Ranquitte
North
218
28
+679%
434
67
+548%
Baie de Henne North-West
% de variation
Plaisance
North
3 959
620
+539%
Limonade
North
3 433
672
+411%
Cap-Haïtien
North
15 840
4 120
+284%
Milot
North
655
178
+268%
Pilate
North
3 852
1 187
+225%
Borgne
Pignon
North
North
622
1 450
202
519
+208%
+179%
La citation
suivante citation
est requise
lors dewhen
l’utilisation
desdata
données
et informations
incluses
ce rapport
: « Organisation
Internationale
The following
is required
using the
and information
included
in thisdans
report:
“International
Organization
for
Migrations
(OIM),
septembre
deofla the
situation
de déplacement
Haïti. IOM
OIM Haïti
Pour
plusinformation
d'informations sur
Migration
(IOM),
September
2024,2024,
DTMEvaluations
Assessment
displacement
situation en
in Haiti.
Haiti. »For
more
terms
19 pour les
les termes
conditions
produits products,
d'informations
DTM,
https://dtm.iom.int/terms-and-conditions
and et
conditions
for des
DTMrapports
reports et
andes
information
please
see:veuillez consulter :
https://dtm.iom.int/terms-and-conditions.
�HAITI – MOBILITY TRACKING
Displacement situation in Haiti – September 2024
RETURNEES FORMERLY IDPs
65,535
Returned individuals
15,980
Returned households
Figure 50. Return locations
31%
Increase in the number
of returnees compared
to Round 7
Data collection:
01 August – 04 September 2024
Publication : 22 September 2024
Figure 51. Returned persons by area of return
Returned
Area of return
# of returnees % of returnees
households
MAPAP
10,260
41,783
64%
West
Outside MAPAP
274
1,404
2%
South
2,856
11,138
17%
Centre
800
3,997
6%
Artibonite
791
3,618
6%
North-West
649
2,111
3%
Grande'Anse
350
1,484
2%
Nippes
0
0
0%
Nord-East
0
0
0%
South-East
0
0
0%
North
0
0
0%
TOTAL
15,980
65,535
100%
Figure 52. Top 5 municipalities of return
Municipalities
Departments
# of returnees
% of returnees
Cité Soleil
Port-au-Prince
Tiburon
West
West
Sud
17 308
10 863
9 982
26%
17%
15%
Croix-Des-Bouquets
West
8 595
13%
Pétion-Ville
West
4 288
7%
Data collection showed that 65,535 people who were internally displaced returned to their area of origin, 31% more than in Round 7, particularly in the municipality of Cité Soleil where a
151% increase in the number of returnees was observed. In this municipality, gang groups agreed in July 2024 to observe a truce and several barricades separating neighborhoods were
removed*. This seems to have prompted IDPs to return to their place of origin.
However, it should be noted that these returns cannot be considered sustainable returns for the moment. These are circumstantial and very fragile returns. For example, despite the July 2024
truce in Cité Soleil, gang groups clashed there in September 2024, pushing more than 2,000 people to flee their homes again**.
The DTM will continue to monitor return trends as well as their sustainability.
*https://vantbefinfo.com/cite-soleil-des-gangs-rivaux-font-la-paix/
**ETT 47
INTERNATIONAL
ORGANIZATION
FOR MIGRATIONS
ORGANISATION
INTERNATIONALE
POUR
LES MIGRATIONS
Website:
https://dtm.iom.int/haiti
Site web:
https://dtm.iom.int/haiti
Contact:
dtmhaiti@iom.int
Contact:
dtmhaiti@iom.int
La citation
suivante citation
est requise
lors dewhen
l’utilisation
desdata
données
et informations
incluses
ce rapport
: « Organisation
Internationale
The following
is required
using the
and information
included
in thisdans
report:
“International
Organization
for
Migrations
(OIM),
septembre
deofla the
situation
de déplacement
Haïti. IOM
OIM Haïti
Pour
plusinformation
d'informations sur
Migration
(IOM),
September
2024,2024,
DTMEvaluations
Assessment
displacement
situation en
in Haiti.
Haiti. »For
more
terms
20 pour les
les termes
conditions
produits products,
d'informations
DTM,
https://dtm.iom.int/terms-and-conditions
and et
conditions
for des
DTMrapports
reports et
andes
information
please
see:veuillez consulter :
https://dtm.iom.int/terms-and-conditions.
�In addition to this report, other information products are available to strengthen the understanding of the displacement
situation in Haiti:
✓ A report of results from household surveys, complementing the understanding of displacement dynamics by
providing analysis on relationships between IDPs and host communities, impacts of IDPs’ arrival in these
communities, the displacement history of IDPs and their return intentions https://iomdtmhaiti.info/3Zy4PG8
✓ The round 8 dataset https://iomdtmhaiti.info/4gwtpNR
✓ An interactive map https://iomdtmhaiti.info/3TttIjr
✓ The list of spontaneous sites https://iomdtmhaiti.info/4exo1bh
DTM.IOM.INT/Haïti
dtmhaiti@iom.int
September 2024
�