Republic of Haiti
Document Library
5,425 documents 255,663 pages
Consumer Price Index Bulletin, August 2026

Consumer Price Index Bulletin, August 2026

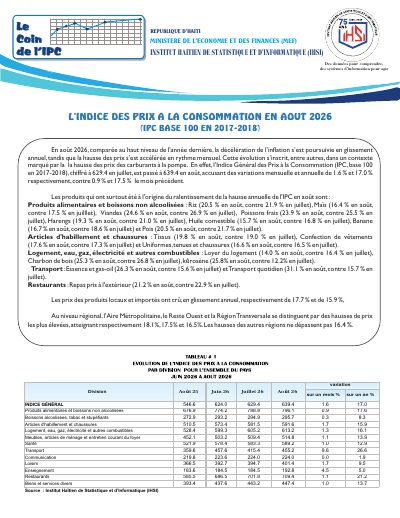
Summary — Haiti's Consumer Price Index (base 100 = 2017-2018) rose from 629.4 in July to 639.4 in August 2026, up 1.6% on the month and 17.0% year-on-year, against 0.9% and 17.5% in July. The annual rate slowed for a fourth consecutive month to its lowest since September 2021, while the monthly rise was the fastest since April 2026. Higher pump prices lifted the transport index 9.6% on the month, reversing most of July's fall, and school fees pushed education up 4.5%.
Key Findings
Full Description

The general Consumer Price Index (base 100 = 2017-2018) rose from 629.4 in July 2026 to 639.4 in August, a monthly increase of 1.6% and an annual increase of 17.0%, against 0.9% and 17.5% the previous month. The annual rate has slowed for four consecutive months and is the lowest the index has recorded since September 2021, but the monthly rise is the fastest since April 2026.

IHSI attributes the acceleration in part to higher fuel prices at the pump. The transport index rose from 415.4 to 455.2, up 9.6% on the month and 26.6% on the year, recovering most of the 9.2% fall it recorded in July: gasoline and diesel rose to 26.3% year-on-year from 15.6% in July, and daily transport fares to 31.1% from 15.7%. Kerosene rose to 25.8% from 12.2%. Education rose 4.5% on the month, to an index of 192.8, as the school year opened.

Food and non-alcoholic beverages slowed to 0.9% on the month and 17.6% on the year, from 1.9% and 19.0% in July, with rice at 20.5% against 21.9%, corn 16.4% against 17.5%, meat 24.6% against 26.9%, fresh fish 23.9% against 25.5%, herring 19.3% against 21.0%, cooking oil 15.7% against 16.8%, banana 16.7% against 18.6% and peas 20.5% against 21.7%. Housing, water, gas, electricity and other fuels rose 1.3% on the month and 16.1% on the year, with housing rent at 14.0% against 16.4% and charcoal at 25.3% against 26.8%. Restaurants rose 21.2% on the year, with meals taken outside the home at 21.2% against 22.9%. Clothing and footwear rose 15.9% on the year, with fabrics at 19.8% against 19.0%.

Locally produced goods rose 17.7% year-on-year and imported goods 15.9%, against 18.3% and 16.3% the previous month. This edition drops the regional index table and reports regional rates in the text only: the Metropolitan Area, the Rest of the West and the Transversal Region posted the largest increases at 18.1%, 17.5% and 16.5%, and no other region exceeded 16.4%.

Sectors
Geography
Time Coverage
2026 — 2026
Full Document Text

Extracted text from the original document for search indexing.

Le Coin de l’IPC REPUBLIQUE D’HAITI MINISTERE DE L’ECONOMIE ET DES FINANCES (MEF) INSTITUT HAITIEN DE STATISTIQUE ET D’INFORMATIQUE (IHSI) Des données pour comprendre, des systèmes d’information pour agir L'INDICE DES PRIX A LA CONSOMMATION EN AOUT 2026 (IPC BASE 100 EN 2017-2018) En août 2026, comparée au haut niveau de l'année dernière, la décélération de l’inflation s’est poursuivie en glissement annuel, tandis que la hausse des prix s’est accélérée en rythme mensuel. Cette évolution s’inscrit, entre autres, dans un contexte marqué par la la hausse des prix des carburants à la pompe. En effet, l’Indice Général des Prix à la Consommation (IPC, base 100 en 2017-2018), chiffré à 629.4 en juillet, est passé à 639.4 en août, accusant des variations mensuelle et annuelle de 1.6 % et 17.0 % respectivement, contre 0.9 % et 17.5 % le mois précédent. Les produits qui ont surtout été à l'origine du ralentissement de la hausse annuelle de l'IPC en août sont : Produits alimentaires et boissons non alcoolisées : Riz (20.5 % en août, contre 21.9 % en juillet), Maïs (16.4 % en août, contre 17.5 % en juilllet), Viandes (24.6 % en août, contre 26.9 % en juillet), Poissons frais (23.9 % en août, contre 25.5 % en juillet), Harengs (19.3 % en août, contre 21.0 % en juillet), Huile comestible (15.7 % en août, contre 16.8 % en juillet), Banane (16.7 % en août, contre 18.6 % en juillet) et Pois (20.5 % en août, contre 21.7 % en juillet). Articles d'habillement et chaussures : Tissus (19.8 % en août, contre 19.0 % en juillet), Confection de vêtements (17.6 % en août, contre 17.3 % en juillet) et Uniformes, tenues et chaussures (16.6 % en août, contre 16.5 % en juillet). Logement, eau, gaz, électricité et autres combustibles : Loyer du logement (14.0 % en août, contre 16.4 % en juillet), Charbon de bois (25.3 % en août, contre 26.8 % en juillet), kérosène (25.8% en août, contre 12.2% en juillet). Transport : Essence et gas-oil (26.3 % en août, contre 15.6 % en juillet) et Transport quotidien (31.1 % en août, contre 15.7 % en juillet). Restaurants : Repas pris à l'extérieur (21.2 % en août, contre 22.9 % en juillet). Les prix des produits locaux et importés ont crû, en glissement annuel, respectivement de 17.7 % et de 15.9 %, Au niveau régional, l’Aire Métropolitaine, le Reste Ouest et la Région Transversale se distinguent par des hausses de prix les plus élevées, atteignant respectivement 18.1%, 17.5% et 16.5%. Les hausses des autres régions ne dépassent pas 16.4 %. variation Division INDICE GÉNÉRAL Produits alimentaires et boissons non alcoolisées Boissons alcoolisées, tabac et stupéfiants Articles d'habillement et chaussures Logement, eau, gaz, électricité et autres combustibles Meubles, articles de ménage et entretien courant du foyer Santé Transport Communication Loisirs Enseignement Restaurants Biens et services divers Source : Institut Haïtien de Statistique et d’Informatique (IHSI) Ao ût 25 Juin 26 Juillet 26 Ao ût 26 546.6 676.9 272.9 510.5 528.4 452.1 521.9 359.6 219.8 366.5 183.6 585.5 393.4 624.0 774.2 293.2 573.4 599.3 503.2 578.4 457.6 223.6 392.7 184.5 686.5 437.6 629.4 788.8 294.9 581.5 605.2 509.4 583.3 415.4 224.0 394.7 184.5 701.8 443.2 639.4 796.1 295.7 591.6 613.2 514.8 589.2 455.2 224.0 401.4 192.8 709.4 447.4 sur un mois % sur un an % 1.6 0.9 0.3 1.7 1.3 1.1 1.0 9.6 0.0 1.7 4.5 1.1 1.0 17.0 17.6 8.3 15.9 16.1 13.9 12.9 26.6 1.9 9.5 5.0 21.2 13.7 IPC Août 25 Sept. 25 Oct. 25 Nov. 25 Déc. 25 Janv. 26 Fév. 26 Mars 26 Avril 26 Mai 26 Juin 26 Juillet 26 Août 26 IPC Global 31.1 31.9 32.2 28.3 25.0 23.5 22.1 20.6 21.0 20.0 18.9 17.5 17.0 IPC des Produits Locaux 33.3 34.1 34.5 30.7 27.3 25.5 23.8 21.4 21.6 20.6 19.7 18.3 17.7 IPC des Produits Importes 27.9 28.7 28.7 24.8 21.5 20.5 19.4 19.2 20.0 19.0 17.6 16.3 15.9 Source : Institut Haïtien de Statistique et d’Informatique (IHSI) INSTITUT HAITIEN DE STATISTIQUE ET D’INFORMATIQUE (IHSI) Delmas 83, Rue Begonia # 2 Tél. : (509) 2943-2665 e-mail : ihsi@http://ihsi.gouv.ht / dse@ihsi.gouv.ht

How to cite

Haitian Institute of Statistics and Informatics (IHSI), Consumer Price Index Bulletin, August 2026, https://ihsi.gouv.ht/public/storage/ipc-bulletins/September2026/l4DCcovagW7FJp671vca.pdf

Rights holder
Institut Haïtien de Statistique et d'Informatique (IHSI)