Full Description
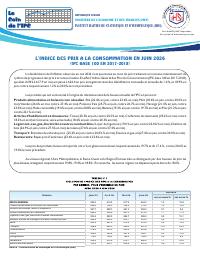
The general Consumer Price Index (base 100 = 2017-2018) rose from 617.9 in May 2026 to 624.0 in June, a monthly increase of 1.0% and an annual increase of 18.9%, against 1.2% and 20.0% the previous month. IHSI presents this as a continuation of the deceleration that began in May, and it is the slowest annual rate the index has recorded since September 2021. The slowdown is broad across the household basket. Food and non-alcoholic beverages eased to 19.4% year-on-year, with rice at 22.4% in June against 23.6% in May, corn 18.4% against 20.0%, meat 26.6% against 27.4%, fresh fish 25.7% against 26.7%, herring 21.4% against 23.0%, cooking oil 19.6% against 20.8%, banana 19.2% against 19.7% and peas 21.2% against 22.1%.
Clothing and footwear slowed to 17.2%, with fabrics at 20.3%, garment-making 18.2% and suits 18.6%. Housing, water, gas, electricity and other fuels came in at 19.1%, with housing rent decelerating sharply to 19.0% from 22.0% and charcoal to 26.9% from 27.5%, while kerosene fell to 27.6% from 37.4%. Transport remains the fastest-rising division at 28.3% year-on-year, but its index actually fell on the month, from 459.4 to 457.6 (-0.4%), as gasoline and diesel eased to 27.4% from 30.0% and private vehicle maintenance to 25.2% from 26.0%.
Restaurant meals taken outside the home were unchanged at 23.6%. Locally produced goods rose 19.7% year-on-year and imported goods 17.6%, against 20.6% and 19.0% the previous month. Regionally the Metropolitan Area, the Rest of the West and the Transversal Region again posted the largest increases at 19.8%, 19.4% and 18.8%, with the remaining regions below 18.0%; the North was the slowest at 16.9%.
Full Document Text
Extracted text from the original document for search indexing.
Le
Coin
de l’IPC
REPUBLIQUE D’HAITI
MINISTERE DE L’ECONOMIE ET DES FINANCES (MEF)
INSTITUT HAITIEN DE STATISTIQUE ET D’INFORMATIQUE (IHSI)
Des données pour comprendre,
des systèmes d’information pour agir
L'INDICE DES PRIX A LA CONSOMMATION EN JUIN 2026
(IPC BASE 100 EN 2017-2018)
La décélération de l'inflation observée en mai 2026 s'est poursuivie au mois de juin, traduisant un nouveau ralentissement du
rythme de progression des prix à la consommation. En effet, l’Indice Général des Prix à la Consommation (IPC, base 100 en 2017-2018),
qui était chiffré à 617.9 en mai, est passé à 624.0 en juin, enregistrant ainsi des désinflations mensuelle et annuelle de 1.0 %, et 18.9% en
juin, contre respectivement 1.2 % et 20.0%, le mois précédent.
Les produits qui ont surtout été à l'origine du ralentissement de la hausse annuelle de l'IPC en juin sont :
Produits alimentaires et boissons non alcoolisé : Riz (22.4% en juin, contre 23.6% en mai), Maïs (18.4% en juin, contre 20.0% en
mai),Viandes (26.6% en mai, contre 27.4% en mai), Poissons frais (25.7% en juin, contre 26.7% en mai), Harengs (21.4% en juin, contre
23.0% en mai), Huile comestible (19.6% en juin, contre 20.8% en mai), Banane (19.2% en juin, contre 19.7% en mai) et Pois (21.2% en juin,
contre 22.1% en mai).
Articles d'habillement et chaussures : Tissus (20.3% en juin, contre 20.5% en mai), Confection de vêtements (18.2% en mai, contre
18.3% en avril) et Costume, veste universelle (18.6% en juin, contre 20.3% en mai).
Logement, eau, gaz, électricité et autres combustibles : Loyer du logement (19.0 % en juin, contre 22.0% % en mai), Charbon de
bois (26.9% en juin, contre 27.5% en mai), kerosène (27.6% en juin, contre 37.4% en mai).
Transport : Entretien de véhicule privé (25.2% en juin, contre 26.0% % en mai), Essence et gas-oil (27.4% en juin, contre 30.0% en mai).
Restaurants : Repas pris à l'extérieur (23.6% en juin, contre 23.6% en mai).
Les prix des produits locaux et importés ont crû, en glissement annuel, respectivement de 19.7% et de 17.6 %, contre 20.6% et
19.0% le mois précédent.
Au niveau régional, l’Aire Métropolitaine, le Reste Ouest et la RégionTransversale se distinguent par des hausses de prix les
plus élevées, atteignant respectivement 19.8%, 19.4% et 18.8%. En revanche, les autres régions ne dépassent pas la barre de 18.0%.
variation
Juin 25
Avril 26
Mai 26
Juin 26
INDICE GÉNÉRAL
Produits alimentaires et boissons non alcoolisées
525.0
610.5
617.9
648.4
752.0
764.5
Boissons alcoolisées, tabac et stupéfiants
267.7
288.7
Articles d'habillement et chaussures
489.2
Logement, eau, gaz, électricité et autres combustibles
Meubles, articles de ménage et entretien courant du foyer
Division
sur un mois %
sur un an %
624.0
1.0
18.9
774.2
1.3
19.4
291.2
293.2
0.7
9.5
558.9
567.4
573.4
1.1
17.2
503.4
592.0
594.7
599.3
0.8
19.1
436.4
495.0
500.1
503.2
0.6
15.3
Santé
505.5
567.9
573.8
578.4
0.8
14.4
Transport
356.8
462.3
459.4
457.6
-0.4
28.3
Communication
218.5
223.3
223.6
223.6
0.0
2.3
Loisirs
349.0
390.6
391.8
392.7
0.2
12.5
Enseignement
176.0
184.2
184.5
184.5
0.0
4.8
Restaurants
555.3
670.5
675.1
686.5
1.7
23.6
Biens et services divers
379.3
430.1
433.8
437.6
0.9
15.4
Source : Institut Haïtien de Statistique et d’Informatique (IHSI)
�IPC
Juin 25
Juillet 25 Août 25
Sept. 25
Oct. 25
Nov. 25
Déc. 25
Janv. 26
Fév. 26
Mars 26
Avril 26
Mai 26
Juin 26
IPC Global
28.4
29.6
31.1
31.9
32.2
28.3
25.0
23.5
22.1
20.6
21.0
20.0
18.9
IPC des Produits Locaux
30.8
32.0
33.3
34.1
34.5
30.7
27.3
25.5
23.8
21.4
21.6
20.6
19.7
IPC des Produits Importes
24.9
26.2
27.9
28.7
28.7
24.8
21.5
20.5
19.4
19.2
20.0
19.0
17.6
Source : Institut Haïtien de Statistique et d’Informatique (IHSI)
Région
Aire métropolitaine (AM)
Composition
Port-au-Prince, Delmas, Pétion-Ville, Carrefour,Tabarre, Cité Soleil
et Croix des Bouquets
variation
sur un mois % sur un an %
Juin 25
Avril 26
Mai 26
Juin 26
524.4
613.5
621.7
628.4
1.1
19.8
Reste Ouest
Départements du Sud-Est et de l’Ouest sans l’AM
548.4
640.4
648.0
654.6
1.0
19.4
Nord
Départements du Nord, du Nord-Est et du Nord-Ouest
493.7
566.7
572.2
577.1
0.9
16.9
Sud
Départements du Sud, de la Grande-Anse et des Nippes
550.0
635.0
642.8
649.1
1.0
18.0
Transversale
Départements du Centre et de l’Artibonite
510.6
594.3
601.0
606.6
0.9
18.8
Source : Institut Haïtien de Statistique et d’Informatique (IHSI)
INSTITUT HAITIEN DE STATISTIQUE ET D’INFORMATIQUE (IHSI)
Delmas 83, Rue Begonia # 2
Tél. : (509) 2943-2665
e-mail : ihsi@http://ihsi.gouv.ht / dse@ihsi.gouv.ht
�