Description Complète
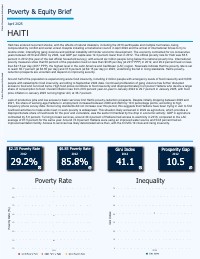
Haïti continue de lutter contre de graves défis de pauvreté aggravés par des catastrophes naturelles récurrentes, l'instabilité politique et l'escalade de la violence des gangs. L'économie s'est contractée pendant six années consécutives entre 2019 et 2024, le PIB réel par habitant chutant de 12,3% par rapport aux niveaux de 2012. Le taux de pauvreté officiel s'élevait à 58,5% en 2012, avec 29,2% de la population vivant avec moins de 2,15$ par jour, le taux le plus élevé de la région Amérique latine et Caraïbes.
Les projections nowcast indiquent une situation qui s'aggrave, avec des taux de pauvreté qui devraient atteindre 66,7% à 3,65$ par jour et 37,6% à 2,15$ par jour d'ici 2025. Environ la moitié de la population connaît une insécurité alimentaire aiguë, dont 2 millions de personnes avec une insécurité alimentaire d'urgence. Les taux d'inflation élevés de 29,7% globalement et de 36,7% pour les prix alimentaires en janvier 2025 aggravent davantage les conditions de vie.
Les populations rurales font face à des taux de pauvreté significativement plus élevés à 74,4% comparé à 40,1% dans les zones urbaines. Le niveau d'éducation est fortement corrélé aux niveaux de pauvreté, avec 70,7% de ceux sans éducation vivant dans la pauvreté contre seulement 12,7% de ceux ayant une éducation supérieure. L'accès aux services de base reste extrêmement limité, avec seulement 40,4% ayant accès à l'électricité, 74,9% utilisant des sources d'eau améliorées, et 54,8% ayant des installations sanitaires améliorées.
L'analyse de la pauvreté multidimensionnelle révèle que 68,8% manquent d'accès à l'assainissement de niveau limité et 64,3% n'ont pas accès à l'électricité. Avec les défis sécuritaires persistants et les opportunités d'emploi productif limitées, les perspectives de réduction de la pauvreté en Haïti restent très incertaines et dépendantes de l'établissement de la stabilité et de la sécurité.
Texte Intégral du Document
Texte extrait du document original pour l'indexation.
Poverty & Equity Brief
20
30
40
50
60
70
80
90
Poverty Rate (%)
2012
0
10
20
30
40
50
60
70
Gini Index
2012
HAITI
$2.15 Poverty Rate
29.2%
Prosperity Gap
10.5
Gini Index
41.1
Poverty by Group Poverty Rate (%)
Urban population 40.1
Rural population 74.4
Males 58.9
Females 57.2 4
0 to 14 years old 66.4
15 to 64 years old 53.2
65 and older 55.3
Without education (16+) 70.7
Primary education (16+) 60.3
Secondary education (16+) 44.7
Tertiary/post-secondary education (16+) 12.7
Latin America & the Caribbean
Multidimensional Poverty Components (% of Pop.)
Daily income less than US$2.15 per person 29.2
At least one school-aged child is not enrolled in school 9.0
No adult has completed primary education 23.1
No access to limited-standard drinking water 33.5
No access to limited-standard sanitation 68.8
No access to electricity 64.3
Harmonization
Poverty Data & Methodology
Poverty Rate Inequality
Poverty at Different Lines
Poverty Line Number of Poor
(Thousands)
Rate
(%)
Year
National Poverty Line 6,019.2 58.5 2012
International Poverty Line ($2.15/day) 2,939.6 29.2 2012
Lower Middle Income Class Poverty Line ($3.65/day) 5,843.3 58.0 2012
Upper Middle Income Class Poverty Line ($6.85/day) 8,640.0 85.8 2012
Multidimensional Poverty Measure 46.8 2012
$6.85 Poverty Rate
85.8%
April 2025
Poverty Economist: Jonathan W. Lain
Note:
N/A denotes a missing/removed value, while N/A* refers to a value which was removed due to having fewer than 30 observations.
The rates in the Poverty by Group table above are shown at the $3.65 lower-middle income line.
Data for the Poverty by Group table is derived from a 2012 survey and data for the Multidimensional Poverty Components table is derived from a 2012 survey.
Haiti has endured recurrent shocks, with the effects of natural disasters, including the 2010 earthquake and multiple hurricanes, being
compounded by conflict and social unrest. Despite installing a transitional council in April 2024 and the arrival of international forces to try to
restore order, intensifying gang violence and political instability still hinder economic development. The economy contracted for six consecutive
years between 2019 and 2024: by 2024, real GDP per capita was 12.3 percent lower than in 2012. The official poverty rate for Haiti was 58.5
percent in 2012 (the year of the last official household survey), with around six million people living below the national poverty line. International
poverty measures show that 58 percent of the population lived on less than $3.65 per day (at 2017 PPP) in 2012, and 29.2 percent lived on less
than $2.15 per day (2017 PPP), the highest level in the Latin America and Caribbean (LAC) region. Nowcasts indicate that the poverty rate is set
to reach 66.7 percent (at $3.65 per day) and 37.6 percent (at $2.15 per day) in 2025, underlining the fall in living standards. Haiti’s poverty-
reduction prospects are uncertain and depend on improving security.
Around half of the population is experiencing acute food insecurity, including 2 million people with emergency levels of food insecurity and 6,000
people with catastrophic food insecurity, according to September 2024 data. Continued proliferation of gang violence has further disrupted
access to food and non-food items. High food prices contribute to food insecurity and disproportionately hurt poorer Haitians who devote a larger
share of consumption to food. Overall inflation rose from 20.9 percent year-on-year in January 2024 to 29.7 percent in January 2025, with food
price inflation in January 2025 running higher still, at 36.7 percent.
Lack of productive jobs and low access to basic services limit Haiti’s poverty-reduction prospects. Despite initially dropping between 2020 and
2021, the share of working-age Haitians in employment increased between 2020 and 2023 by 10.6 percentage points, according to high
frequency phone survey data. Since living standards did not increase over this period, this suggests that Haitians have been trying in vain to find
livelihood activities to make ends meet; in-work poverty is widespread. This situation likely worsened in 2024 as agriculture, which provides a
disproportionate share of livelihoods for the poor and vulnerable, was the sector hit hardest by the drop in economic activity: GDP in agriculture
contracted by 5.6 percent. Turning to basic services, around 40.4 percent of Haitians had access to electricity in 2016, compared to the LAC
average of 97.5 percent for the same year. Around 74.9 percent Haitians were using an improved water source and 54.8 percent had an
improved sanitation facility. Access to services has likely deteriorated since then, with the COVID-19 crisis and rising insecurity.
The last national household survey suitable for monetary poverty measurement, the Enquête sur les Conditions de Vie des Ménages Apres le Séisme (ECVMAS), was
conducted in 2012. More recent estimates of poverty are constructed using nowcasts. These nowcasts take the 2012 ECVMAS data, combine them with
macroeconomic data on economic growth and population growth, construct up-to-date estimates of household consumption levels, and calculate poverty accordingly.
Collecting a new household survey with detailed information on consumption is unlikely to be feasible in Haiti in the coming years. Yet other methods, including phone
surveys, mobile phone data, and geospatial data may help address Haiti’s data gaps.
Poverty in Haiti is measured using the cost-of-basic-needs methodology, applied to the 2012 ECVMAS. Per-capita household expenditure is used as the welfare
aggregate and includes both food and non-food expenditures. The poverty line reflects a minimum threshold of 2,300 calories per person per day and is based on a
food basket of 26 food items. The national overall poverty line is close to the $3.65 (2017 PPP) international poverty line, being just 0.9 percent higher. The national
extreme poverty line is 12.7 percent lower than the $2.15 (2017 PPP) international poverty line.
The numbers presented in the brief are based on the regional data harmonization effort known as the Socio-economic Database for Latin America and the Caribbean
(SEDLAC) - a joint effort of the World Bank and CEDLAS from the National University of La Plata (Argentina). SEDLAC includes 18 countries and more than 300
household surveys since the 80s. Several Caribbean countries have not been included in the SEDLAC project due to lack of data. Since an income-based welfare
aggregate is widely used in the region for official poverty estimates, income-based microdata is used for the Global Monitoring Database (GMD) and Global Poverty
Monitoring. SEDLAC covers demographics, income, employment, and education. Terms of use of the data adhere to agreements with the original data producers.
Group and Multidimensional Poverty
2012 2012 2012 2012
Public Disclosure Authorized
Public Disclosure Authorized
Public Disclosure Authorized
Public Disclosure Authorized
Poverty & Equity Brief
20
30
40
50
60
70
80
90
Poverty Rate (%)
2012
0
10
20
30
40
50
60
70
Gini Index
2012
HAITI
$2.15 Poverty Rate
29.2%
Prosperity Gap
10.5
Gini Index
41.1
Poverty by Group Poverty Rate (%)
Urban population 40.1
Rural population 74.4
Males 58.9
Females 57.2 4
0 to 14 years old 66.4
15 to 64 years old 53.2
65 and older 55.3
Without education (16+) 70.7
Primary education (16+) 60.3
Secondary education (16+) 44.7
Tertiary/post-secondary education (16+) 12.7
Latin America & the Caribbean
Multidimensional Poverty Components (% of Pop.)
Daily income less than US$2.15 per person 29.2
At least one school-aged child is not enrolled in school 9.0
No adult has completed primary education 23.1
No access to limited-standard drinking water 33.5
No access to limited-standard sanitation 68.8
No access to electricity 64.3
Harmonization
Poverty Data & Methodology
Poverty Rate Inequality
Poverty at Different Lines
Poverty Line Number of Poor
(Thousands)
Rate
(%)
Year
National Poverty Line 6,019.2 58.5 2012
International Poverty Line ($2.15/day) 2,939.6 29.2 2012
Lower Middle Income Class Poverty Line ($3.65/day) 5,843.3 58.0 2012
Upper Middle Income Class Poverty Line ($6.85/day) 8,640.0 85.8 2012
Multidimensional Poverty Measure 46.8 2012
$6.85 Poverty Rate
85.8%
April 2025
Poverty Economist: Jonathan W. Lain
Note:
N/A denotes a missing/removed value, while N/A* refers to a value which was removed due to having fewer than 30 observations.
The rates in the Poverty by Group table above are shown at the $3.65 lower-middle income line.
Data for the Poverty by Group table is derived from a 2012 survey and data for the Multidimensional Poverty Components table is derived from a 2012 survey.
Haiti has endured recurrent shocks, with the effects of natural disasters, including the 2010 earthquake and multiple hurricanes, being
compounded by conflict and social unrest. Despite installing a transitional council in April 2024 and the arrival of international forces to try to
restore order, intensifying gang violence and political instability still hinder economic development. The economy contracted for six consecutive
years between 2019 and 2024: by 2024, real GDP per capita was 12.3 percent lower than in 2012. The official poverty rate for Haiti was 58.5
percent in 2012 (the year of the last official household survey), with around six million people living below the national poverty line. International
poverty measures show that 58 percent of the population lived on less than $3.65 per day (at 2017 PPP) in 2012, and 29.2 percent lived on less
than $2.15 per day (2017 PPP), the highest level in the Latin America and Caribbean (LAC) region. Nowcasts indicate that the poverty rate is set
to reach 66.7 percent (at $3.65 per day) and 37.6 percent (at $2.15 per day) in 2025, underlining the fall in living standards. Haiti’s poverty-
reduction prospects are uncertain and depend on improving security.
Around half of the population is experiencing acute food insecurity, including 2 million people with emergency levels of food insecurity and 6,000
people with catastrophic food insecurity, according to September 2024 data. Continued proliferation of gang violence has further disrupted
access to food and non-food items. High food prices contribute to food insecurity and disproportionately hurt poorer Haitians who devote a larger
share of consumption to food. Overall inflation rose from 20.9 percent year-on-year in January 2024 to 29.7 percent in January 2025, with food
price inflation in January 2025 running higher still, at 36.7 percent.
Lack of productive jobs and low access to basic services limit Haiti’s poverty-reduction prospects. Despite initially dropping between 2020 and
2021, the share of working-age Haitians in employment increased between 2020 and 2023 by 10.6 percentage points, according to high
frequency phone survey data. Since living standards did not increase over this period, this suggests that Haitians have been trying in vain to find
livelihood activities to make ends meet; in-work poverty is widespread. This situation likely worsened in 2024 as agriculture, which provides a
disproportionate share of livelihoods for the poor and vulnerable, was the sector hit hardest by the drop in economic activity: GDP in agriculture
contracted by 5.6 percent. Turning to basic services, around 40.4 percent of Haitians had access to electricity in 2016, compared to the LAC
average of 97.5 percent for the same year. Around 74.9 percent Haitians were using an improved water source and 54.8 percent had an
improved sanitation facility. Access to services has likely deteriorated since then, with the COVID-19 crisis and rising insecurity.
The last national household survey suitable for monetary poverty measurement, the Enquête sur les Conditions de Vie des Ménages Apres le Séisme (ECVMAS), was
conducted in 2012. More recent estimates of poverty are constructed using nowcasts. These nowcasts take the 2012 ECVMAS data, combine them with
macroeconomic data on economic growth and population growth, construct up-to-date estimates of household consumption levels, and calculate poverty accordingly.
Collecting a new household survey with detailed information on consumption is unlikely to be feasible in Haiti in the coming years. Yet other methods, including phone
surveys, mobile phone data, and geospatial data may help address Haiti’s data gaps.
Poverty in Haiti is measured using the cost-of-basic-needs methodology, applied to the 2012 ECVMAS. Per-capita household expenditure is used as the welfare
aggregate and includes both food and non-food expenditures. The poverty line reflects a minimum threshold of 2,300 calories per person per day and is based on a
food basket of 26 food items. The national overall poverty line is close to the $3.65 (2017 PPP) international poverty line, being just 0.9 percent higher. The national
extreme poverty line is 12.7 percent lower than the $2.15 (2017 PPP) international poverty line.
The numbers presented in the brief are based on the regional data harmonization effort known as the Socio-economic Database for Latin America and the Caribbean
(SEDLAC) - a joint effort of the World Bank and CEDLAS from the National University of La Plata (Argentina). SEDLAC includes 18 countries and more than 300
household surveys since the 80s. Several Caribbean countries have not been included in the SEDLAC project due to lack of data. Since an income-based welfare
aggregate is widely used in the region for official poverty estimates, income-based microdata is used for the Global Monitoring Database (GMD) and Global Poverty
Monitoring. SEDLAC covers demographics, income, employment, and education. Terms of use of the data adhere to agreements with the original data producers.
Group and Multidimensional Poverty
2012 2012 2012 2012