Texte extrait du document original pour l'indexation.
HAITI
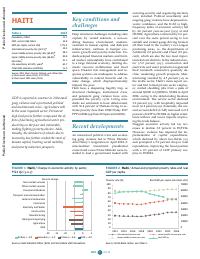
Table 1 2023
Population, million 11.7
GDP, current US$ billion 20.8
GDP per capita, current US$ 1771.5
International poverty rate ($2.15)
a
29.2
Lower middle-income poverty rate ($3.65)
a
58.0
Upper middle-income poverty rate ($6.85)
a
85.8
Gini index
a
41.1
Life expectancy at birth, years
b
63.7
Total GHG emissions (mtCO2e) 11.0
Source: WDI, Macro Poverty Outlook, and official data.
a/ Most recent value (2012), 2017 PPPs.
b/ Most recent WDI value (2022).
GDP is expected to contract in 2024 amid
gang violence and a protracted political
and institutional crisis. Agriculture will
be the most impacted sector. Persistent
high food prices further compound the ef-
fects of declining agricultural sector pro-
ductivity on the poor and vulnerable,
making fighting poverty elusive. Addi-
tionally, the shutdown of schools due to
insecurity has further eroded the stock of
human capital, limiting social mobility
and poverty reduction prospects.
Key conditions and
challenges
Deep structural challenges including state
capture by vested interests, a non-en-
abling business environment, underin-
vestment in human capital, and deficient
infrastructure, continue to hamper eco-
nomic growth and poverty reduction. Un-
derdeveloped financial markets and limit-
ed market contestability have contributed
to a large informal economy, limiting do-
mestic resource mobilization and fiscal
space. Disaster risk management and re-
sponse systems are inadequate to address
vulnerability to natural hazards and cli-
mate change, which disproportionately
impactsthepoor.
Haiti faces a deepening fragility trap, as
structural challenges, institutional crisis,
and persistent gang violence have com-
pounded the poverty cycle. Living stan-
dards are estimated to have deteriorated,
with 36.4 percent of Haitians living in ex-
treme poverty (less than US$2.15/day 2017
PPP)in2024(upfrom29.9percentin2020).
Recent developments
An unresolved political crisis and escalat-
ing gang violence led to Prime Minister
Ariel Henry’s resignation in April 2024. A
nine-member transitional presidential
council and a new Prime Minister were in-
stalled to lead a government tasked with
restoring security and organizing elections
were installed. Political uncertainty and
ongoing gang violence have depressed in-
vestor confidence, and the ICAE (a high-
frequency index of economic activity) fell
by 4.0 percent year-on-year (yoy) at end
H12024. Agriculture contracted by 6.6 per-
cent over the same period owing to low
rainfall and violent gangs driving farmers
off their land in the country’s two largest
producing areas, i.e. the departments of
Artibonite (33 percent) and Ouest (19 per-
cent), which are also the two most impor-
tant electoral districts. In the industrial sec-
tor (-5.2 percent yoy), construction and
electricity and water production registered
their twentieth consecutive quarterly de-
cline, weakening growth prospects. Man-
ufacturing receded by 4.5 percent yoy as
the textile sector, Haiti’s main export sec-
tor and first formal private sector employ-
er, started shedding jobs from a peak of
around 60,000 in Q12022 to 32,084 in April
2024, owing to the deteriorating business
environment. The service sector declined
3.0 percent yoy, with hospitality impacted
most (-6.2 percent yoy). Externally, the cur-
rent account deficit (CAD) narrowed to 0.2
percent of GDP in H12024 on higher remit-
tance inflows and lower imports improv-
ing the trade balance.
Sluggish economic activity led tax rev-
enues to decline 3.0 percent in H1FY24.
However, violence has impaired the im-
plementation of capital expenditures,
which declined by about two-thirds yoy
and prompted a 5.0 percent drop in total
expenditure, improving the fiscal position
with a 0.3 percent of GDP primary sur-
plusinH12024.
FIGURE 1Haiti/ Change in economic activity by sector,
FY24 Q2 (y-o-y)
-20-15-10-50 5
ICAE
Agriculture
Mining and quarrying
Manufacturing
Construction
Electricity and Water
Commerce
Hotel and restaurants
Tr
ansport and communication
Financial institutions
Other market services
Non-market services
Tertiary = -3.0Secondary = -5.2Primary = -6.6ICAE = -4.0
Percent change
Sources: Haiti Statistical Office (IHSI) and World Bank staff calculations.
FIGURE 2Haiti/ Actual and projected poverty rates and real
GDP per capita
0
10000
20000
30000
40000
50000
60000
70000
0
10
20
30
40
50
60
70
80
90
100
20122014201620182020202220242026
International poverty rate Lower middle-income pov. rate
Upper middle-income pov. rateReal GDP pc
Real GDP per capita (constant LCU)Poverty rate (%)
Source: World Bank. Notes: see Table 2.
1
Public Disclosure Authorized
Public Disclosure Authorized
Public Disclosure Authorized
Public Disclosure Authorized
CPI inflation declined from 31.9 percent at
the end of 2023 to 28.3 percent by end-May
2024. However, food inflation has been ris-
ing (29.3 percent at end-2023 to 40.5 per-
cent end-May 2024), driven by the com-
bined effect of higher global cereal prices,
low agricultural productivity, and supply
chain disruption caused by violent gangs’
blockages. As of June 2024, 50 percent of
the population faced acute food insecurity,
with the South, West, and North-East be-
ing the most affected departments.
The central bank (BRH) has maintained a
restrictive monetary policy stance with
sterilized forex interventions, bond sales,
and unchanged policy rate at 11.5 percent
since the 120 basis points hike in August
2022. For the first time in many years, mon-
etary financing remained within statutory
limits of 20 percent of previous fiscal year’s
tax revenues. This bodes well for BRH’s
objective of anchoring inflation expecta-
tions and favors exchange rate stability,
with the gourde appreciating by 15.1 per-
cent in H12024.
As per the Government's request, the
World Bank, with support from other de-
velopment partners, is leading a Rapid Cri-
sis Impact Assessment (RCIA) to estimate
the crisis’ impact on the economy and the
population to help develop a short-term
Crisis Recovery Framework to transition
out of the crisis. The RCIA provides a
platform for coordinated aid from the
World Bank, United Nations, European
Union, and Inter-American Development
Bank, and alignment with broader inter-
national humanitarian, development, and
securityefforts.
Outlook
Private investment is expected to remain
depressed amid persistent insecurity and
private consumption is forecast to recede
owing to weak agricultural wage income
and persistent inflation. All sectors of the
economy are expected to decline, trig-
gering a 4.2 percent GDP contraction in
2024. Modest GDP growth is expected in
2025 and 2026, assuming improvements
in political stability and security ahead
of expected elections before the end of
2025. Albeit growth is stabilizing, pover-
ty is expected to remain elevated, with
36.6 percent of the population project-
ed to live on less than US$2.15/day 2017
PPPin2026.
The CAD is forecast to narrow due to
declining imports and increasing remit-
tance inflows. It is expected to widen
modestly over the medium term to
around 1.0 percent of GDP as pent-up
investmentdemandincreasesimports.
The restrictive monetary policy stance, al-
beit with limited effectiveness because of
high dollarization (55 percent in H12024),
is expected to further strengthen the
gourde and support price stability. Infla-
tion is forecast to average 26.1 percent over
2024. Despite an expected decline in tax
revenue, the fiscal deficit should narrow
from 2.3 percent of GDP in FY23 to 0.6 per-
cent of GDP in 2024 owing to retrenchment
of capex, containment of non-priority ex-
penditures, and lower debt service thanks
to debt cancellation from Venezuela. The
debt relief will improve Haiti’s debt indi-
cators from 24.2 percent of GDP in 2023 to
15.2 percent in 2024.
The outlook is fraught with downside
risks and depends heavily on an effective
political transition and improvements in
security. Prudent economic policies, sup-
ported by a credible budgetary frame-
work and an appropriate mix of fiscal
and monetary policy will remain key to
reducing inflation, strengthening growth
prospects, and fighting poverty. Long-
term inclusive growth will require
strengthening the business environment
and the institutional framework for dis-
aster risk management, including better
preparednessandresponsesystems.
TABLE 2Haiti/ Macro poverty outlook indicators (annual percent change unless indicated otherwise)
2020/21 2021/22 2022/23 2023/24e 2024/25f 2025/26f
Real GDP growth, at constant market prices -1.8 -1.7 -1.9 -4.2 0.5 1.5
Private consumption 1.2 -0.7 0.1 -0.3 0.4 1.0
Government consumption 9.7 17.6 3.3 -15.1 57.6 9.2
Gross fixed capital investment -28.8 -9.9 -17.6 -31.5 -74.8 52.9
Expor
ts, goods and services 23.5 2.4 -9.6 -4.4 2.0 2.5
Imports, goods and services 2.3 4.9 -0.4 -3.1 6.0 5.5
Real GDP growth, at constant factor prices -2.8 -1.8 -3.6 -4.2 0.5 1.5
Agriculture -4.1 -4.5 -5.6 -4.5 1.0 2.5
Industry -2.5 -0.4 -3.7 -4.0 1.5 2.0
Services -2.5 -1.6 -3.0 -4.2 -0.2 1.0
Inflation (consumer price index) 15.9 27.6 44.2 26.1 30.6 14.7
Current account balance (% of GDP) 0.4 -2.4 -3.3 -0.2 -0.4 -2.0
Net foreign direct investment inflow (% of GDP) 0.2 0.2 0.1 0.2 0.2 0.2
Fiscal balance (% of GDP) -2.7 -3.2 -2.3 -0.6 -2.5 -1.9
Revenues (% of GDP) 6.9 6.6 7.4 7.4 7.3 7.2
Debt (% of GDP) 28.4 27.6 24.2 15.2 16.5 17.1
Primary balance (% of GDP) -2.4 -2.9 -2.0 -0.3 -2.2 -1.6
International poverty rate ($2.15 in 2017 PPP)
a,b
31.3 32.3 34.2 36.3 36.8 36.5
Lower middle-income poverty rate ($3.65 in 2017 PPP)
a,b
60.1 61.6 62.8 65.5 66.0 65.8
Upper middle-income poverty rate ($6.85 in 2017 PPP)
a,b
87.5 88.0 88.6 89.6 89.7 89.6
GHG emissions growth (mtCO2e) 0.4 0.5 -0.4 -0.4 1.0 1.5
Energy related GHG emissions (% of total) 35.5 35.0 34.0 33.1 32.7 32.5
Source: World Bank, Poverty & Equity and Macroeconomics, Trade & Investment Global Practices. Emissions data sourced from CAIT and OECD.
Notes: e = estimate, f = forecast.
a/ Calculations using 2012-ECVMAS. Actual data: 2012. Nowcast: 2013-2023. Forecasts are from 2024 to 2026.
b/ Projection using neutral distribution (2012) with pass-through = 0.87 (Med (0.87)) based on GDP per capita in constant LCU.
2