Texte extrait du document original pour l'indexation.
Haiti — Displacement Situation
Round 14 | August 2026
�2
The opinions expressed in this publication are those of the authors and do not necessarily reflect the views of the International Organization for Migration (IOM). The designations employed
and the presentation of material throughout the publication do not imply expression of any opinion whatsoever on the part of IOM concerning the legal status of any country, territory, city or
area, or of its authorities, or concerning its frontiers or boundaries.
IOM is committed to the principle that humane and orderly migration benefits migrants and society. As an intergovernmental organization, IOM acts with its partners in the international
community to: assist in meeting the operational challenges of migration; advance understanding of migration issues; encourage social and economic development through migration; and uphold
the human dignity and well-being of migrants.
This publication was made possible thanks to the financial support of the US Department of State. The opinions expressed herein are those of the authors and do not necessarily reflect those
of the US Department of State.
Publisher: International Organization for Migration
Rue E. Pierre, 11 (Zone Ambassade des États-Unis)
Tabarre 27
Port-au-Prince, Haïti
Email: dtmhaiti@iom.int
Website: dtm.iom.int/haiti
This publication was issued without formal editing by IOM. This publication was issued without IOM Publications Unit (PUB) approval for adherence to IOM’s brand and style standards. This
publication was issued without IOM Research Unit (RES) endorsement
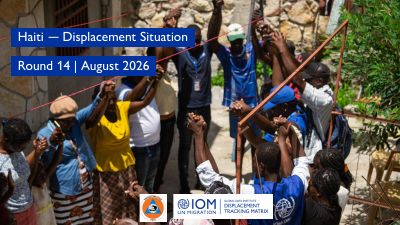
Cover photo: Group psychosocial support session with newly displaced persons living in a spontaneous site © IOM Haiti, August 2026
Required citation: International Organization for Migration (IOM), August 2026, Displacement situation in Haiti as of August 2026 – Round 14. IOM Haiti.
Data collection was jointly
carried out with :
These activities were
implemented with
the support of:
�3
TABLE OF CONTENTS
SUMMARY
4
ANALYSES ABOUT INTERNALLY DISPLACED PERSONS
DISAGGREGATION BY AGE AND SEX
8
HOST LOCATIONS FOR INTERNALLY DISPLACED PERSONS
9
DISPLACEMENT TRENDS
10
ORIGINS OF INTERNALLY DISPLACED PERSONS
12
FOCUS ON THE METROPOLITAN AREA OF PORT-AU-PRINCE
13
FOCUS ON THE COMMUNES OF THE WEST (OUTSIDE THE METROPOLITAN AREA OF PORT-AU-PRINCE )
15
FOCUS ON THE FOUR DEPARTMENTS OF THE GREAT SOUTH
16
FOCUS ON THE ARTIBONITE DEPARTMENT
17
FOCUS ON THE CENTRE DEPARTMENT
18
FOCUS ON THE THREE DEPARTMENTS OF THE GREAT SOUTH
19
ANALYSES ABOUT RETURNEES (FORMER INTERNALLY DISPLACED PERSONS)
RETURN AREAS OF RETURNEES
21
FOCUS ON THE METROPOLITAN AREA OF PORT-AU-PRINCE
22
FOCUS ON THE CENTRE DEPARTMENT
23
PRIORITY NEEDS
24
ANNEX: METHODOLOGY
26
�SUMMARY
4
1,494,456
internally displaced persons (IDPs)
(13% of the Haitian population1)
351,185
displaced households
+2% Increase in the number of IDPs compared to Round 13 (May 2026)
85%
of IDPs are in host
families/out of sites
236
15%
are in sites
102 sites in the capital, hosting 204,750 IDPs
(-4% compared to Round 13)
spontaneous sites
(26 less compared to Round 13)
134 sites in provinces, hosting 15,498 IDPs
(-19% compared to Round 13)
79%
of IDPs are hosted in
provinces2.
42% of IDPs are hosted in
only 10 communes :
1.
2.
21%
of IDPs are hosted in the
capital.
Port-au-Prince (in the department of the West, with 9% of
IDPs in the country); Delmas (West, 6%); Jacmel (South-East,
5%); Verrettes (Artibonite, 4%); Cap-Haïtien (North, 3%);
Léogâne (West, 3%); Les Cayes (South, 3%); Aquin (South,
3%); Cité Soleil (West, 3%); Belladère (Centre, 3%).
171,203
Returned persons
37,380
Returned households
Increase in the number of returnees compared to
+3% Round 13 (May 2026)
▪ Between Rounds 13 and 14, the number of Internally Displaced Persons (IDPs)
increased by 2 per cent, from 1.47 million to 1.49 million people. While this
increase was relatively limited at the national level, it masked significant regional
disparities. Artibonite recorded the largest increase (+16%), reflecting the continued
deterioration of the security situation in the department and new displacement triggered
by armed violence.
▪ Despite a 10 per cent decrease in the number of spontaneous sites (from 262 to 236),
notably linked to the closure of six sites hosting more than 21,000 IDPs in the
Metropolitan Area of Port-au-Prince (MAPAP), the total number of IDPs in the
capital continued to increase (+1%). Violence in Cité Soleil triggered new
displacement to other sites within the capital as well as to the departments of the Great
South region.
▪ The number of returnees increased by three per cent between Rounds 13
and 14, reaching 171,203 individuals. This increase was primarily driven by
returns observed in the MAPAP (+70%) and in the Centre department
(+29%), which together host more than four fifths of all returnees recorded nationwide.
▪ However, these returns remain largely precarious. In the MAPAP, returnees
emphasized that the sustainability of their return depends on improved security
conditions, the rehabilitation of housing and community infrastructure, and access to
livelihood opportunities. In the Centre department, an increasing share of returns has
been observed to communes where the security situation remains fragile (Mirebalais and
Saut-d’Eau). Several households reported choosing to return despite persistent risks,
citing the difficult economic conditions and lack of livelihood opportunities in their areas
of displacement.
This percentage is calculated based on the latest population estimate produced by the Haitian Institute of Statistics and Informatics (IHSI), which places Haiti’s population at 11,867,032 inhabitants.
The term "provinces" refers to all areas of the country outside the Metropolitan Area of Port-au-Prince (MAPAP), the capital. The MAPAP consists of the communes of Port-au-Prince, Delmas, Cité Soleil, Pétion-Ville, Carrefour, Tabarre, and Croix-des-Bouquets
�Internally Displaced Persons
5
Table 1. Number and proportion of IDPs by host area
Map 1. Number of IDPs per department
Host regions
# of displaced
households
# of IDPs
% of IDPs
MAPAP
Outside MAPAP
South
South-East
Great South(39%)
Grande'Anse
Nippes
84,699
23,596
45,530
39,576
30,496
18,506
313,270
112,084
200,386
178,807
132,588
73,914
21%
8%
13%
12%
9%
5%
Artibonite (12%)
38,848
183,654
12%
Centre (10%)
34,136
26,209
4,447
5,142
351,185
144,541
115,050
19,402
20,760
1,494,456
10%
8%
1%
1%
100%
West (29%)
North
Great North (10%) North-West
North-East
TOTAL
Table 2. IDPs outside sites / with host families vs. in sites, by host area
Host regions
# of IDPs
% of IDPs out of
sites
% of IDPs in
sites
# of sites
MAPAP
Outside MAPAP
South
South-East
Great South
Grande'Anse
Nippes
Artibonite (11%)
313,270
112,084
200,386
178,807
132,588
73,914
183,654
35%
97%
100%
100%
100%
100%
97%
65%
3%
0%
0%
0%
0%
3%
102
11
0
0
0
0
61
Centre (10%)
144,541
96%
99.7%
100%
99%
85%
4%
0.3%
0%
1%
15%
57
West
This map is for illustration purposes only. Names and boundaries on this map do not imply official endorsement or acceptance by IOM.
Great
North
North
North-West
North-East
TOTAL
115,050
19,402
20,760
1,494,456
4
0
1
236
4
�Returnees – formerly internally displaced
Map 2. Number of returnees formerly IDPs, by department
6
Table 3. Number and proportion of returnees (former IDPs) by return area
# of returned
households
# of returned
individuals
% of returned
individuals
MAPAP
19,952
86,591
51%
Outside MAPAP
4,692
22,252
13%
South
0
0
0%
South-East
0
0
0%
Grande'Anse
0
0
0%
Nippes
0
0
0%
Artibonite (4%)
1,446
6,955
4%
Centre (31%)
10,790
53,100
31%
0
0
0%
Great North (1%) North – West
500
2,305
1%
North - East
0
0
0%
TOTAL
37,380
171,203
100%
Areas of return
West (64%)
Great South (0%)
North
This map is for illustration purposes only. Names and boundaries on this map do not imply official endorsement or acceptance by IOM
�ANALYSES ABOUT INTERNALLY DISPLACED PERSONS
Distribution of Non-Food Items to internally displaced persons in the capital © IOM Haiti, November 2024
�Disaggregation by age and sex of
internally displaced persons
8
Graph 2. Disaggregation by age and sex of IDPs residing in sites
Graph 1. Disaggregation by age and sex of IDPs
60+
60+
4%
18 - 59
18%
11%
6 - 11
9%
<1
18 - 59
22%
12 - 17
1-5
4%
Female
(55%)
6 - 11
7%
5%
32%
26%
12 - 17
9%
6%
4% 4%
Female
(54%)
Male
(46%)
4% 3%
<1
1%
1%
Graph 3. Disaggregation by age and sex of IDPs residing outside sites*
60+
The demographic composition of Internally Displaced Persons (IDPs) remains the same
compared to previous assessments: more than half (55%) are women (adults and minors), and
children represent 52 per cent of all IDPs. Furthermore, a persistent difference between IDPs
living in sites and those residing outside sites continues to be observed: in sites, adults are the
majority (66% versus 34% children), while outside sites, children constitute the majority of IDPs
(55% versus 45% adults). This disparity is mainly explained by the severity of living conditions in
sites, which leads many displaced persons to entrust their children to relatives, often sending
them from the capital to the provinces.
7%
5% 5%
1-5
Male
(45%)
3% 2%
8%
4%
18 - 59
20%
12 - 17
6 - 11
1-5
<1
4%
16%
11%
Female
(55%)
10%
9%
8%
6%
5%
3% 3%
* Due to rounding, percentages may not add up to 100 per cent
Male
(45%)
�Host locations for internally displaced persons
9
As in Round 13, nearly half of all IDPs (42%) were concentrated in just ten of the country’s 140 communes, highlighting the strong concentration of displacement in a limited number of host areas
(see Table 4 and Map 4). Although the list of the ten main host communes has remained largely unchanged over the past several rounds, the commune of Cité Soleil moved from 15th position in
Round 13 to 9th during this round. This reflects the impact of armed violence that affected this commune in May and June 2026, forcing thousands of people to flee their places of residence3.
As in previous assessments, the majority of IDPs continue to be hosted in provinces, which host 79 per cent of all IDPs, compared to 21 per cent within MAPAP, the capital. Outside MAPAP, almost
all IDPs (99%) live outside displacement sites, primarily with host families or in rented accommodation. By contrast, within MAPAP, nearly two thirds of IDPs (65%) reside in spontaneous
displacement sites.
Furthermore, of the 236 spontaneous sites identified across the country, 102 (43%) are located in MAPAP and 134 (57%) outside MAPAP. However, despite being fewer in number, the sites located
in the capital host the vast majority of IDPs living in sites. The 102 sites in MAPAP host 204,750 people, compared to only 15,498 people across the 134 sites located outside MAPAP. This difference
is explained by the substantially higher population density of sites in the capital, which host an average of 2,007 IDPs per site, compared to 116 outside MAPAP.
Table 4. Top 10 host communes for IDPs
Commune
Department # of IDPs
Map 3. IDPs by department and presence of spontaneous sites
Map 4. IDPs by commune and presence of spontaneous sites
% of IDPs in
the country
Port-au-Prince
West
140,893
9%
Delmas
West
83,987
6%
Jacmel
South-East
75,751
5%
Verrettes
Artibonite
63,304
4%
Cap-Haïtien
North
50,932
3%
Léogâne
West
49,637
3%
Les Cayes
South
45,435
3%
Aquin
South
45,329
3%
Cité Soleil
West
41,041
3%
Belladère
Centre
39,072
3%
These maps are for illustration purposes only. Names and boundaries on these maps do not imply official endorsement or acceptance by IOM
3. For more information, please refer to the following Emergency Tracking reports #93.2and #97
�Displacement trends
10
Between Round 13 (May 2026) and Round 14 (August 2026), the total number of IDPs increased slightly by two per cent. However, this moderate increase at the national level masks significant
regional disparities.
The Artibonite department recorded the largest increase (+16%), rising from 158,358 IDPs in Round 13 to 183,654 in Round 14. This increase reflects the continued deterioration of the security
situation in the department, where several armed violence incidents triggered the displacement of thousands of people between May and August 20264. The most significant increases were
observed in the communes of Petite-Rivière de l’Artibonite (+104%), Gonaïves (+73%), Saint-Michel de l’Attalaye (+57%), L’Estère (+42%) and Dessalines (+39%) – see page 17 for further details.
At the same time, the number of spontaneous sites identified across the country decreased from 262 in Round 13 to 236 in Round 14, representing a 10 per cent reduction. This decline is notably
linked to an initiative undertaken by authorities to close a number of sites within MAPAP. As part of this initiative, six sites hosting more than 21,000 IDPs were closed between June and July 2026.
However, this reduction in the number of sites did not result in a proportional decrease in the number of displaced persons living in sites in the capital. Indeed, despite the closure of six sites that
had accommodated more than 21,000 IDPs, the population residing in sites within MAPAP declined only from 213,168 persons in Round 13 to 204,750 in Round 14, a decrease of just 4 per cent
(-8,418 IDPs). This trend is largely explained by significant violences that occurred in Cité Soleil between the two rounds, which triggered new displacements towards other sites in the capital5,
thereby offsetting part of the effect of the site closures. These incidents also contributed to a slight increase in the total number of IDPs within MAPAP (+1%), while generating additional population
movements towards departments of the Great South, where IDP figures increased between the two rounds.
Table 4. Change in the number of IDPs between Rounds 13 and 14, by host area
Host regions
# of IDPs in Round 13 # of IDPs in Round 14
Great South
# of sites in Round 14
North
North-West
North-East
313,270
112,084
200,386
178,807
132,588
73,914
183,654
144,541
115,050
19,402
20,760
+1%
-13%
+3%
+2%
+8%
+2%
+16%
-2%
-2%
-7%
+3%
112
14
0
0
0
0
65
66
4
0
1
102
11
0
0
0
0
61
57
4
0
1
TOTAL
1,466,862
1,494,456
+2%
262
236
Artibonite
Centre
Great North
# of sites in Round 13
309,716
129,053
193,965
175,231
123,080
72,753
158,358
146,739
117,032
20,862
20,073
MAPAP
Outside MAPAP
South
South-East
Grande'Anse
Nippes
West
% of variation
4. For more information, please refer to the following Emergency Tracking reports #94, #95, #98, #101.2, #102 and #103
5. For more information, please refer to the following Emergency Tracking reports #93.2 and #97
�11
Graph 4. Evolution of the displacement situation between 2022 and August 2026
863% increase in the number of IDPs in nearly three years (comparison of the situation between the end of 2022 and August 2026)
3% increase in the number
of IDPs between end 2025
and August 2026
39% increase in the number of IDPs in 2025
232% increase in the number of IDPs during the year
2024 (comparison of the situation between the end of
2023 and the end of 2024)
1,412,199
1,450,254
1,494,456
1,466,862
1,287,593
102% increase in the number of IDPs during
the year 2023 (comparison of the situation
between the end of 2022 and the end of 2023)
1,041,229
702,973
578,074
313,901
194,624
155,166
113,582
362,551
127,977
Round 1
(September 2022)
Round 2
(November 2022)
2022
Round 3 (March Round 4 (June 2023)Round 5 (December Round 6 (March Round 7 (June 2024)
Round 8
Round 9 (December
2023)
2023)
2024)
(September 2024)
2024)
2023
2024
Round 10 (June
2025)
Round 11
(September 2025)
2025
Round 12
(December 2025)
Round 13 (May
2026)
Round 14 (August
2026)
2026
�Origins of internally displaced persons
Graph 6. Departments of origin (left) and host departments (right) of IDPs
Map 5. Number of IDPs per communes of origin
This map is for illustration purposes only. Names and boundaries on this map do not imply official endorsement or acceptance by IOM
Graph 5. communes of origin of IDPs
1%
Artibonite (13%)
<1%
<1%
Marigot
1%
Other
1%
Mirebalais
13%
3%
Other
7%
L'Estère
Croix-Des-Bouquets
3%
Saint-Marc
Carrefour
2%
Dessalines
Cité Soleil
West (74%)
2%
Petite Rivière de
l'Artibonite
5%
Other
7%
Arcahaie
7%
Kenscoff
7%
Delmas
18%
Gressier
Port-au-Prince
23%
Centre (13%)
SouthEast
(<1%)
12
Nearly three quarters of all IDPs (74%) fled locations in the West department, particularly the MAPAP, which
alone accounts for 51 per cent of all places of origin reported by IDPs. Armed violence in the Centre and
Artibonite departments has also made these areas significant sources of displacement. For the first time since
the start of displacement tracking rounds in September 2022, following the armed violence that occurred in
the commune of Marigot in April 20266, the South-East department appears among the areas of origin of IDPs,
although it represents only a limited share of the displaced population.
Displacement patterns vary across areas of origin. IDPs fleeing the West department, and especially the
MAPAP, primarily moved to other communes within the West department as well as to departments in the
Greater South. In contrast, people displaced from the Centre and Artibonite departments largely remained
within their department of origin or moved towards the departments of Great North.
Information on IDPs’ places of origin is collected through key informants in each hosting location. Key informants identify the commune of
origin of the majority of IDPs residing in their locality. The statistics presented here should therefore be interpreted as an indication of the
main displacement trends and patterns observed, rather than as a precise estimate of the number of people who fled each commune. A
more detailed analysis of places of origin, displacement trajectories and movement patterns is conducted through DTM annual household
surveys, the results of which for 2026 will be published at a later stage.
6. For more information, please refer to the following Emergency Tracking report #89.1
�Focus on the Metropolitan Area of Port-au-Prince
313,270
84,699
internally displaced persons
displaced households
Carte 6. Displacement situation in the neighborhoods of the MAPAP
13
35%
increase in the number of IDPs,
+1% compared to Round 13
of IDPs are in host
families/out of sites
% of IDPs % of variation
in the
compared to
MAPAP
Round 13
Commune
# of IDPs
Port-au-Prince
140,893
45%
-12%
Delmas
83,987
27%
+1%
Cité Soleil
41,041
13%
+88%
Pétion-Ville
28,871
9%
+18%
Carrefour
10,193
3%
+0.3%
Tabarre
Croix-DesBouquets
TOTAL
5,467
2%
-27%
2,818
1%
+10%
313,270
100%
+1%
Neighborhood
Commune
Bois Verna
Port-au-Prince
Sarthe
Cité Soleil
Delmas 2 - Saint-Martin
Port-au-Prince
- Tokyo
Cite Louverture
Port-au-Prince
Bolosse
Port-au-Prince
Kernizan - Defilee Delmas
Charlemagne Peralte
Martissant - Breard Port-au-Prince
Sainte-Bernadette
Siloe
Delmas
Cite Plus
Port-au-Prince
Kernizan
Delmas
Graph 7. Evolution of the number of IDPs in the MAPAP from 2022 to August 2026
R1 (Aug
2022)
33,830
13,756
% of IDPs in
the MAPAP
11%
4%
12,550
4%
11,216
8,267
4%
3%
7,831
2%
7,751
2%
6,883
6,440
6,248
2%
2%
2%
309,716
293,410
291,717
R11 (Sept
2025)
R12 (Dec
2025)
313,270
184,789
173,156
127,977
87,985
This map is for illustration purposes only. Names and boundaries on this map do not imply official endorsement or
acceptance by IOM.
139,853 160,550
(-10 sites compared to
Round 13)
# of IDPs
296,936
261,448
130,884
spontaneous sites
in sites
Table 6. Top 10 host neighborhoods for IDPs in the MAPAP
Table 5. IDPs by host commune in the MAPAP
155,166
102
65%
R2 (Nov
2025)
R3 (March
2023)
R4 (Jun
2023)
R5 (Nov
2023)
R6 (March
2024)
R7 (Jun
2024)
R8 (Sept
2024)
R9 (Dec
2024)
R10 (Jun
2025)
R13 (May R14 (August
2026)
2026)
The number of IDPs in the MAPAP increased by one per cent between Rounds 13 and 14, despite a reduction in the number of sites, which decreased from 112 to 102 following an initiative by authorities to close several sites
across the capital. Despite these closures, the overall number of IDPs in the MAPAP continued to rise slightly, primarily due to the armed violence that occurred in the commune of Cité Soleil.
Unlike previous rounds, IDPs residing in the commune of Port-au-Prince account for less than half of the capital’s displaced population (45%) for the first time. This change is largely explained by a 12 per cent decrease in the
number of IDPs in the commune compared to Round 13, following the closure of several sites under the government-led site closure initiative. A significant proportion of households who were in these sites returned to their
areas of origin, although often under precarious return conditions (see the section on returnees from page 20 onwards). At the same time, the number of IDPs in the commune of Cité Soleil nearly doubled between the two
rounds (+88%), reflecting the impact of the armed violence that took place there between May and June 2026.
It is also important to highlight that, unlike in the rest of the country, IDPs in the MAPAP continue to live predominantly in spontaneous sites (65%, or 204,750 individuals), making the capital the only area of the country where
this type of accommodation remains the dominant living arrangement. Finally, nearly all IDPs in the MAPAP (96%) fled from other neighbourhoods within the same metropolitan area, while four per cent originated from the
neighbouring commune of Kenscoff.
�14
In the MAPAP, each site hosts an average of 2,007 IDPs. The distribution of IDPs between site and non-site settings changed slightly compared to the previous round, with 65 per cent
of IDPs living in spontaneous sites and 35 per cent living outside sites, compared to 69 per cent and 31 per cent, respectively, in Round 13.
Among IDPs living in sites in the capital, 40 per cent reside in schools, representing 81,547 individuals across 36 schools. This figure has remained virtually unchanged since Round 13,
when 80,932 IDPs were hosted in 37 schools. In an effort to reduce the impact of displacement on access to education, the Education, Shelter, and CCCM Clusters have developed
guidelines aimed at balancing the accommodation and protection needs of IDPs in school facilities with the continuation of educational activities7.
Map 7. Types of sites in the MAPAP
Table 7. IDPs outside sites / with host families vs. in sites, by host commune in the MAPAP
% of IDPs out of % of IDPs
sites
in sites
commune
# of IDPs
# of sites
Port-au-Prince
140,893
11%
89%
49
Delmas
83,987
59%
41%
22
Cité Soleil
41,041
17%
83%
18
Pétion-Ville
28,871
73%
27%
6
Carrefour
10,193
86%
14%
3
Tabarre
Croix-DesBouquets
5,467
84%
16%
3
2,818
77%
23%
1
TOTAL
313,270
35%
65%
102
Table 8. IDPs by type of sites in the MAPAP
Type of sites
This map is for illustration purposes only. Names and boundaries on this map do not imply official endorsement or acceptance by IOM.
7. For more information, please consult these guidelines (only available in French)
# of sites # of IDPs in sites
% of IDPs in
sites
School
36
81,547
40%
Uncovered and fenced area
18
38,711
19%
Covered and fenced area
19
38,426
19%
Church / Temple
21
35,334
17%
Uncovered and unfenced area
6
8,830
4%
Covered and unfenced area
2
1,902
1%
TOTAL
102
204,750
100%
�Focus on communes of the West (out of the Metropolitan Area of Port-au-Prince)
displaced households
Map 8. Displacement situation in the communes of the West outside the MAPAP
-13%
Table 9. IDPs by host commune in the communes of the West outside the MAPAP
% of variation
Commune
# of IDPs
% of IDPs
compared to
Round 13
49,637
15,970
14,091
11,332
10,994
4,091
3,950
1,637
382
44%
14%
13%
10%
10%
4%
4%
1%
0.3%
+0.4%
+2%
+0.4%
+2%
-59%
-4%
+10%
-15%
-82%
Total
112,084
100%
-13%
spontaneous sites
in sites
of IDPs are in host
families/out of sites
Léogâne
Grand-Goâve
Arcahaie
Petit-Goâve
Cabaret
Pointe à Raquette
Anse à Galets
Kenscoff
Cornillon / Grand Bois
11
3%
97%
increase in the number of IDPs,
compared to Round 13
(-3 sites compared
Round 13)
Graph 8. Communes of origin of IDPs living in
areas of West outside the MAPAP
Mirebalais
<1%
Marigot
1%
Cornillon / Grand Bois
<1%
Delmas
<1%
Kenscoff
<1%
Port-au-Prince
1%
West (99%)
internally displaced
persons
23,596
South Centr
-East e
(1%) (<1%)
112,084
15
10%
Cabaret
20%
Arcahaie
67%
Gressier
Graph 9. Evolution of the number of IDPs in the communes of West outside the MAPAP between June 2023 and August 20268
144,152
68,411
10,127
6,168
R4 (Jun 2023) R5 (Nov 2023)
This map is for illustration purposes only. Names and boundaries on this map do not imply official endorsement or acceptance by IOM.
30,929
R6 (March
2024)
115,935
100,020
116,221
129,053
R12 (Dec
2025)
R13 (May
2026)
112,084
24,697
R7 (Jun 2024) R8 (Sept 2024) R9 (Dec 2024) R10 (Jun 2025)
R11 (Sept
2025)
R14 (August
2026)
In the communes of the West department located outside the MAPAP, the number of IDPs decreased by 13 per cent between Rounds 13 and 14, from 129,053 to 112,084 individuals. This decline was primarily
driven by the return of IDPs previously hosted in the commune of Cabaret to the Artibonite department. As a result, Cabaret recorded the largest decrease in the number of IDPs (-59%) between the two rounds.
The commune of Léogâne remains the main host commune for IDPs in this part of the West department, accounting for 44 per cent of the displaced population. The vast majority of IDPs (97%) live outside sites,
while 3 per cent reside in 11 sites located across the communes of Léogâne, Arcahaie, Cabaret and Kenscoff.
Furthermore, nearly all IDPs hosted in the communes of the West department outside the MAPAP originate from locations within the same department (99%). The commune of Gressier remains by far the primary
place of origin, accounting for 67 per cent of reported origins. It is also the second largest place of origin of IDPs nationwide, after Port-au-Prince (see page 12).
8. Before Round 4, DTM assessments were limited to the MAPAP. However, in early 2023, DTM began observing significant population movements from the capital towards other departments across the country, prompting a gradual expansion of the geographic coverage of the assessments.
Starting with Round 4, conducted in June 2023, coverage was extended to the entire West department, as well as the Centre and Artibonite departments. In November 2023 (Round 5), the assessments were further expanded to the four departments of the Greater South. Finally, since Round 7,
conducted in June 2024, the assessments have covered the entire national territory, including the North, North-East and North-West departments.
�Focus on the four departments of the Great South
585,695
internally displaced persons
134,108
displaced households
+4%
increase in the number of IDPs,
compared to Round 13
16
100%
0
of IDPs are in host
families/out of sites
spontaneous site
(same as in
Round 13)
Table 10. Top 10 host communes for IDPs in the Great South
Map 9. Displacement situation in the Great South
Commune
Displaced
Department
# of IDPs
households
Jacmel
Sud-Est
16,996
Les Cayes
Sud
12,199
Aquin
Sud
8,743
Jérémie
Grande'Anse 5,557
Abricots
Grande'Anse 4,925
Torbeck
Sud
5,736
La Vallée
Sud-Est
4,512
Anse d'Hainault Grande'Anse 4,695
Saint louis du Sud
Sud
3,640
Bainet
Sud-Est
3,852
This map is for illustration purposes only. Names and boundaries on this map do not imply official endorsement or acceptance by IOM.
West (99%)
SouthEast
(1%)
Graph 10. Communes of origin of IDPs
hosted in the Great South
Marigot
1%
Kenscoff
2%
Tabarre
2%
Delmas
5%
Croix-Des-Bouquets
9%
Cité Soleil
9%
Carrefour
13%
Port-au-Prince
26%
Gressier
33%
The number of IDPs in the Greater South increased by four per cent between Rounds 13 and 14, rising from
565,029 to 585,695 individuals. This increase was driven in part by the armed violence that occurred in the commune
of Cité Soleil in the capital, which triggered new displacement both within the MAPAP and, to a lesser extent, towards
the departments of the Greater South, which have traditionally been the primary destination for people fleeing the
capital. As a result, the commune of Cité Soleil became the fourth largest place of origin of IDPs hosted in the
Greater South, accounting for nine per cent of reported origins, compared to just one per cent in Round 13.
More broadly, IDPs residing in the Greater South predominantly originate from the capital (65%), particularly from
the commune of Port-au-Prince (26%). However, the commune of Gressier, located in the West department but
outside the capital, remains the primary place of origin of IDPs hosted in the Greater South, accounting for 33 per
cent of reported origins. In addition, for the first time, a commune from the Greater South, namely Marigot in the
South-East department, appears among the places of origin of IDPs (1%), following the armed violence that occurred
in the commune in April 2026.
It is important to note that slightly more than half of all IDPs in the Greater South (53%) are concentrated in just ten
communes out of the region’s 51 communes, highlighting a strong concentration of displaced populations in a limited
number of host areas, primarily urban centres. The communes of Jacmel, Les Cayes and Aquin alone host 29 per
cent of all IDPs residing in the Greater South.
% of IDPs
in the
Great
South
75,751
45,435
45,329
23,984
21,898
20,725
19,938
18,690
17,105
16,794
13%
8%
8%
4%
4%
4%
3%
3%
3%
3%
Graph 11. Evolution of the number of IDPs in the Great South
between the end of 2023 and August 2026
497,768
553,023
563,049
565,029
585,695
398,016
268,452
315,200
116,422
116,422
R5 (Nov R6 (March R7 (Jun
2023)
2024)
2024)
R8 (Sept R9 (Dec R10 (Jun R11 (Sept R12 (Dec R13 (May R14
2024)
2024)
2025)
2025)
2025)
2026) (August
2026)
�Focus on the department of Artibonite
internally displaced persons
displaced households
Map 10. Displacement situation in Artibonite
97%
in the number of IDPs,
+16% increase
compared to Round 13
of IDPs are in host
families/out of sites
3%
Graph 12. Communes of origin of IDPs hosted in Artibonite
% of variation
% of IDPs in
compared to
Artibonite
Round 13
Commune
# of IDPs
Verrettes
Gonaïves
Saint-Michel de l'Attalaye
Saint-Marc
Dessalines
Petite Rivière de l'Artibonite
Gros Morne
63,304
26,428
21,369
19,805
15,735
8,896
7,915
34%
14%
12%
11%
9%
5%
4%
-1%
+73%
+57%
-7%
+39%
+104%
-3%
Anse Rouge
5,364
3%
-22%
Ennery
L'Estère
La Chapelle
Terre Neuve
Marmelade
Grande Saline
4,513
3,249
2,404
2,091
1,477
1,104
2%
2%
1%
1%
1%
1%
+13%
+42%
+4%
+16%
+13%
+6%
Total
183,654
100%
+16%
The Artibonite department recorded the largest increase in the number of IDPs nationwide between Rounds 13 and 14 (+16%).
This increase reflects the continued deterioration of the security situation in the department and the rise in armed violence
incidents that triggered new waves of displacement. The commune of Dessalines was particularly affected by this worsening
security environment. As a result, it became the second largest place of origin of IDPs hosted in Artibonite (26%), whereas it
ranked fourth in Round 13, accounting for only eight per cent of reported origins. Several armed violence incidents in the
commune led to the displacement of thousands of people9. Significant displacement was also observed following violence in other
communes across the department, notably Petite-Rivière de l’Artibonite10, L’Estère11, Gonaïves12, Saint-Marc13 and Saint-Michel de
l’Attalaye14. Consequently, the largest increases in the number of IDPs were recorded in Petite-Rivière de l’Artibonite (+104%),
Gonaïves (+73%), Saint-Michel de l’Attalaye (+57%) and L’Estère (+42%).
As in other departments outside the capital, the vast majority of IDPs in Artibonite live outside sites (97%), primarily with host
families. Only 3 per cent of IDPs (5,634 individuals) reside in 61 spontaneous sites, representing an average of 92 people per site.
Carrefour
<1%
Delmas
1%
Croix-Des-Bouquets
3%
Port-au-Prince
Gros Morne
<1%
Grande Saline
1%
Verrettes
1%
La Chapelle
2%
L'Estère
4%
11%
Dessalines
26%
Petite Rivière de l'Artibonite
84,719
R4 (Juin
2023)
8%
Saint-Marc
Graph 13. Evolution of the number of IDPs in Artibonite
between June 2023 and August 2026
22,440
(-4 sites compared
to Round 13)
spontaneous sites
in sites
Table 11. IDPs by commune in Artibonite
This map is for illustration purposes only. Names and boundaries on this map do not imply official endorsement or acceptance by IOM.
61
West (12%)
38,848
Artibonite (88%)
183,654
17
27,430
27,430
34,952
44,566
R5 (Nov
2023)
R6 (March
2024)
R7 (Jun
2024)
R8 (Sept
2024)
R9 (Dec
2024)
43%
150,279
158,358
R12 (Dec
2025)
R13 (May
2026)
183,654
121,896
92,304
R10 (Jun
2025)
R11 (Sept
2025)
9. For more information, please refer to the following Emergency Tracking reports #98 and #101.2
10. Emergency reports #98, #101.2 and #106
11. Emergency reports #98
12. Emergency reports #94
13. Emergency reports #95, #102 and #104
14. Emergency reports #103
R14 (Aug
2026)
�Focus on the department of Centre
internally displaced persons displaced households
Map 11. Displacement situation in Centre
-2%
96%
decrease in the number of IDPs,
compared to Round 13
of IDPs are in host
families/out of sites
Table 12. IDPs by host commune in Centre
57
4%
spontaneous sites
in sites
Commune
# of IDPs
% of IDPs in
Centre
Belladère
Hinche
Boucan Carré
Mirebalais
Lascahobas
Thomassique
Thomonde
Maïssade
Cerca Carvajal
Saut d'Eau
Savanette
Cerca La Source
Total
39,072
26,994
24,106
13,401
11,515
9,630
6,707
4,650
3,000
2,335
2,162
969
144,541
27%
19%
17%
9%
8%
7%
4%
3%
2%
2%
1%
1%
100%
% of variation
compared to
Round 13
-6%
-1%
-0.4%
-9%
+7%
+7%
-0.1%
+1%
+5%
+12%
-2.4%
+40%
-2%
Graph 15. Evolution of the number of IDPs in Centre between June 2023
and August 2026
This map is for illustration purposes only. Names and boundaries on this map do not imply official
endorsement or acceptance by IOM.
28,975
22,935
22,935
40,753
R4 (June 2023) R5 (Nov 2023) R6 (March 2024) R7 (Jun 2024)
52,045
67,608
(-9 sites compared
to Round 13)
Graph 14. communes of origin of IDPs
hosted in Centre
West (<1%)
34,136
Centre (99.6%)
144,541
18
Croix-Des-Bouquets
.<1%
Lascahobas
<1%
Saut d'Eau
2%
Mirebalais
98%
199,258
162,374
147,230
146,739
144,541
R8 (Sept 2024) R9 (Dec 2024) R10 (Jun 2025) R11 (Sept 2025) R12 (Dec 2025) R13 (May 2026) R14 (Aug 2026)
The decreasing trend in the number of IDPs hosted in the Centre department continued during this round. The number of IDPs in the department decreased by 2 per cent between Rounds 13 and 14. This decline is
part of a broader trend observed since the displacement peak recorded in September 2025 (Round 11), when nearly 200,000 displaced persons were present in the department. The current figure therefore
represents a decrease of approximately 27 per cent compared to that peak.
This trend is partly explained by the returns observed among certain displaced populations (see the section on returnees from page 20 onwards), particularly those who had fled the commune of Lascahobas and
sought refuge in Belladère, and who have now largely returned to their areas of origin. This dynamic is also reflected in the places of origin data: while the commune of Lascahobas accounted for 12 per cent of the
reported origins of IDPs in the Centre during Round 13, its share dropped to less than 1 per cent in Round 14.
The main host communes for IDPs in the Centre remain Belladère (27%), Hinche (19%) and Boucan Carré (17%). The situation in Belladère is particularly noteworthy, as the commune serves both as a major host
area for IDPs and as one of the main entry points for people forcibly returned from the Dominican Republic. More than 78,000 forced returns have been recorded there since the beginning of 202615. The
coexistence of significant needs related to hosting IDPs and assisting forcibly returned individuals places immense pressure on already limited basic services and infrastructure in the commune.
15. For additional information, please consult the Forced Returns Monitoring Dashboard.
�Focus on the three departments of the Great North
displaced households
Map 12. Displacement situation in the Great North
of IDPs are in host
families/out of sites
Table 13. Top 11 host communes for IDPs in the Great North
Commune
Department
Displaced
households
# of IDPs
0.3%
5
in sites
(Same as on
Round 13)
spontaneous sites
Graph 16. Communes of origin of IDPs hosted in the Great North
% of IDPs in
the Great
North
Gros Morne
1%
L'Estère
1%
Desdunes
1%
Artibonite (21%)
internally displaced persons
99.7%
decrease in the number of IDPs,
-2% compared to Round 13
Cap-Haïtien
North
12,733
50,932
33%
Limonade
North
1,810
9,060
6%
Ouanaminthe
North-East
1,717
7,373
5%
Limbé
Pilate
Grande Riviere Du
Nord
Jean Rabel
North
North
1,429
1,360
7,114
6,782
5%
4%
North
1,280
6,260
4%
Autre
3%
North-West
1,193
5,954
4%
Arcahaie
3%
Quartier Morin
North
1,061
5,305
3%
Carrefour
5%
Plaisance
North
1,020
5,100
3%
Delmas
7%
Milot
North
950
4,742
3%
Croix-Des-Bouquets
9%
Borgne
North
989
4,670
3%
This map is for illustration purposes only. Names and boundaries on this map do not imply official endorsement or
acceptance by IOM.
As in Round 13, the decreasing trend in the number of IDPs in the Greater North continued. The number of IDPs decreased from 157,967 to 155,212
individuals between Rounds 13 and 14, representing a two per cent decline, mainly driven by return movements of IDPs to the Centre department (see
the section on returnees from page 20 onwards).
Nearly three quarters of all IDPs in the Greater North (73%) continue to be concentrated in a limited number of communes (11 out of the region’s 42
communes), highlighting a strong concentration of displaced populations in specific host areas. Of these eleven communes, nine are located in the North
department, one in the North-East, and one in the North-West. The commune of Cap-Haïtien remains the primary host commune, accommodating 33
per cent of all IDPs in the region.
Furthermore, the Greater North continues to stand out as the region with the most diverse origins of IDPs nationwide. Forty-five per cent of IDPs fled the
West department (primarily the commune of Port-au-Prince), 34 per cent originated from the Centre department (mainly the commune of Mirebalais),
and 21 per cent came from Artibonite (primarily the commune of Petite-Rivière de l’Artibonite).
Petite Rivière de l'Artibonite
Centre
(34%)
35,798
18%
Mirebalais
West (45%)
155,212
19
34%
Port-au-Prince
18%
Graph 17. Evolution of the number of IDPs in the
Great North between June 2024 and August 2026
166 614
137 075
157 967
155 212
144 592
93 053
84 047
22 841
R7 (Jun
2024)
R8 (Sept
2024)
R9 (Dec
2024)
R10 (Jun R11 (Sept R12 (Dec R13 (May R14 (Aug
2025)
2025)
2025)
2026)
2026)
�ANALYSES ABOUT RETURNEES - FORMERLY INTERNALLY DISPLACED
Visit to a damaged market in a return area for IDPs in the capital © IOM Haiti, September 2026.
�Return areas of returnees
171,203
returned persons
37,380
returned households
Map 12. Return areas for returnees formerly IDPs
21
+3%
increase in the number of
returnees, compared to
Round 13
Table 14. Returnees by return area
57%
43%
are females
(adults and minors)
are children
Table 15. Top 10 communes of return
# of
returned
individuals
% of
returned
individuals
% of variation
compared to
Round 13
MAPAP
86,591
51%
+70%
West (64%) Outside
MAPAP
22,252
13%
-48%
0
0
0%
0%
-100%
-
0
0%
0
Artibonite (4%)
Centre (31%)
North
Areas of return
South
South-East
Great South
Grande'An
(0%)
se
Nippes
Great North North –
West
(1%)
North East
TOTAL
# of
% of
% of variation
Commune Department returned returned compared to
individuals individuals Round 13
Port-auPrince
West
40,020
23%
+37%
Lascahobas
Centre
40,000
23%
+15%
Delmas
West
25,184
15%
+74%
-100%
Cabaret
West
15,071
9%
-3%
0%
-
Pétion-Ville
West
12,014
7%
+487%
6,955
4%
-27%
53,100
31%
+29%
Mirebalais
Centre
11,250
7%
+89%
0
0%
-100%
Cité Soleil
West
5,732
3%
+237%
2,305
1%
0%
Kenscoff
West
3,533
2%
-2%
0
0%
-
Saint-Marc
Artibonite
2,790
2%
+5%
171,203
100%
+3%
Bassin Bleu North-West
2,305
1%
0%
This map is for illustration purposes only. Names and boundaries on this map do not imply
official endorsement or acceptance by IOM.
The number of returnees (formerly internally displaced persons) increased by three per cent between Rounds 13 and 14, rising from 165,937 to 171,203 individuals. This increase was primarily driven
by returns observed in the MAPAP (+70%) and the Centre department (+29%), which host the majority of returnees, accounting for 51 per cent and 31 per cent of all returnees in the country,
respectively. The communes of Port-au-Prince (23% of all returnees nationwide), Lascahobas (23%) and Delmas (15%) alone account for more than 60 per cent of all returnees and all recorded
significant increases between the two rounds.
However, at this stage, these returns cannot be considered sustainable. Returnee households interviewed in the MAPAP identified several key conditions required to sustain their return, including an
increased presence of security forces, the rehabilitation of housing and community infrastructure, and access to livelihood opportunities.
�Focus on the Metropolitan Area of Port-au-Prince
increase in the number of
19,952
86,591
+70% returnees, compared to
returned persons
returned households
22
Round 13
Map 13. Neighborhoods of return of returnees in the MAPAP
Table 17. Top 10 return neighborhoods in the MAPAP
Table 16. Communes of return in the MAPAP
Commune
% of
# of
% of variation
returned
returned
compared to
individuals in
individuals
Round 13
the MAPAP
Port-au-Prince
40,020
46%
+37%
Delmas
25,184
29%
+74%
Pétion-Ville
11,573
13%
+466%
% of
returned
individuals in
the MAPAP
Neighborhood
Commune
# of
returned
individuals
Thomassin Fermathe - Fort
Jacques
Pétion-Ville
9,369
11%
Christ-Roi
Delmas
7,610
9%
Croix Desprez - TiPort-au-Prince
Source
5,914
7%
Ti Savanne - Trantin Port-au-Prince
3,923
5%
Cité Soleil
5,732
7%
+237%
Baillergeau
Port-au-Prince
3,517
4%
Croix-Des-Bouquets
1,873
2%
-26%
Nazon
Delmas
2,403
3%
Tabarre
1,292
1%
+65%
Delmas 30
Delmas
3,260
4%
Carrefour
917
1%
+684%
Cite Plus
Port-au-Prince
3,149
4%
Total
86,591
100%
Campèche
Port-au-Prince
3,011
3%
+70%
Tapis Rouge
Port-au-Prince
2,934
3%
This map is for illustration purposes only. Names and boundaries on this map do not imply official endorsement or
acceptance by IOM.
Nearly three quarters of all returnees in the capital are hosted in the communes of Port-au-Prince (46%) and Delmas (29%). Since the withdrawal of armed groups from several neighbourhoods
located along the border between the communes of Port-au-Prince and Delmas in August 202516, gradual returns have been observed to these areas. This trend has also been reinforced by
authorities’ initiative to close several displacement sites that had been hosting a significant proportion of IDPs originating from these neighborhoods. Together, these factors largely explain the
continued return movements observed in the capital.
However, these returns remain fragile. Returnees interviewed reported that the sustainability of their return depends, among other factors, on a sustained presence of security forces in return
areas, the rehabilitation of housing and community infrastructures, and access to livelihood17. Visits conducted by IOM teams to these neighborhoods revealed extensive damage to housing, water
supply infrastructure, health facilities, schools, and markets.
16. For more details, please refer to this ICG article
17. IOM, April 2026, A study on the return dynamics of internally displaced persons in the neighbourhoods of Bas Delmas and Haut Port-au-Prince, IOM Haiti.
�Focus on the department of Centre
53,100
returned persons
10,790
returned households
+29%
23
increase in the number of
returnees, compared to Round 13
Map 14. Return areas in the Centre
Table 18. Communes of return in the Centre
Commune
# of returned
individuals
% of returned
individuals in
Centre
% of variation
compared to
Round 13
Lascahobas
40,000
75%
+15%
Mirebalais
11,250
21%
+89%
Saut d'Eau
1,850
3%
+249%
Thomassique
0
0%
0%
Cerca Carvajal
0
0%
0%
Boucan Carré
0
0%
0%
Cerca La Source
0
0%
0%
Savanette
0
0%
0%
Hinche
0
0%
0%
Thomonde
0
0%
0%
Belladère
0
0%
0%
Maïssade
0
0%
0%
Total
53,100
100%
+29%
This map is for illustration purposes only. Names and boundaries on this map do not imply official endorsement or
acceptance by IOM.
The increasing trend in returns observed in the Centre department since Round 13 continued during this round, with the number of returnees increasing by 29 per cent. This increase was
primarily driven by the return of a large proportion of IDPs who had fled the commune of Lascahobas and sought refuge in Belladère. As a result, the commune of Lascahobas now hosts three
quarters of all returnees in the department.
Increases were also observed in the communes of Mirebalais and Sauts-d’Eau. However, unlike in Lascahobas, the security situation in these areas remains fragile, and local authorities continue to
advise against returns. Despite this, some displaced households have chosen to return. Many reported to IOM teams that the difficult conditions in host areas, particularly the lack of access to
livelihood opportunities, had led them to return to their areas of origin in order to resume agricultural activities, despite the ongoing protection risks and the possibility of renewed displacement.
These returns often involve only part of the household. Many respondents indicated that some family members, particularly children, remained in the areas of displacement while adults returned
to their places of origin.
�PRIORITY NEEDS
Mobile phone repair training aimed at strengthening livelihood opportunities for displaced youth and host communities in the capital © IOM Haiti, September 2026.
�25
Priority needs
Graph 18. Priority needs reported in IDP and/or returnee host locations
(% of host localities) (Multiple choice question)
During this round, 1,150 localities were assessed, including 1,036 where the
presence of at least one group of IDPs or returnees was identified. In these
localities, key informants reported on the main needs observed. Food remains
the most frequently reported need, having been identified in 80 per cent of
the affected localities. It was followed by livelihoods (62%), shelter (42%), and
water, sanitation and hygiene (41%). Health needs were reported in 28 per
cent of localities, while education (19%), non-food items (14%), and
protection (8%) were reported less frequently.
80%
62%
42%
41%
28%
19%
Food
Livelihood
Shelter
Water,
Sanitation and
Hygiene
Health
Education
14%
Non-Food Items
8%
Protection
Data presented in this section provide an overview of the needs reported by
key informants. To deepen the analysis of vulnerabilities and needs among
IDPs, returnees, and host communities, the Displacement Tracking Matrix
(DTM) conducts annual household surveys to assess their multisectoral needs
in greater depth18. The findings from the analyses conducted in 2026 will be
published at a later stage and will contribute to further informing
humanitarian response planning.
18. International Organization for Migration (IOM), February 2026, Comparative Analysis of the Multisectoral Needs of Iinternally Displaced Persons and Host Communities, IOM
�26
ANNEX: METHODOLOGY
Map 15. Localities assessed in the field during Round 14
1,150
4,262
assessed localities
key informants interviewed
(91% assessed through field
interviews and 9% by phone)
Since August 2022, the Directorate General of Civil Protection (DGPC) and IOM’s
Displacement Tracking Matrix (DTM) have been conducting periodic assessments of localities
hosting displaced populations. These assessments aim to provide baseline information on the
scale and dynamics of displacement, as well as on the living conditions and needs of displaced
populations. Their objective is to inform response strategies, whether for immediate
humanitarian interventions or initiatives aimed at promoting durable solutions.
Data are collected through direct observation and group interviews with key informants at the
smallest geographic level mapped in the country: the neighbourhood within the MAPAP and the
communal section outside the MAPAP. Spontaneous sites are also assessed where they exist.
On average, four key informants are interviewed in each assessed locality.
Data collection for Round 14 was conducted between 15 May and 12 August 2026 by 518
enumerators (62% male and 38% female), who carried out interviews with 4,642 key
informants (68% male and 32% female) across 1,150 assessed localities, including 516
communal sections outside the MAPAP, 398 neighbourhoods within the MAPAP, and 236
spontaneous sites. Due to security constraints, interviews with key informants were conducted
remotely in 9 per cent of assessed localities, while the remaining 91 per cent were carried out
in person (see Map 15).
Data collection was jointly conducted by IOM and DGPC teams.
This map is for illustration purposes only. Names and boundaries on this map do not imply official endorsement or acceptance by IOM.
Limits:
Graph 19. Profiles of key informants interviewed during Round 14
36%
19%
16%
12%
7%
4%
Members of Health, education Representatives
ASEC and
Civil Protection Religious leaders
community-based
and other
of IDPs or
CASEC members focal points
organizations
professionals
returnees
2%
2%
2%
Other
NGO staff
Municipal
authorities
The information presented is based on estimates provided by key informants regarding their
own communities and does not constitute either an exhaustive count or an individual
registration exercise. To generate the most reliable estimates possible, assessments are
conducted at the finest geographic level, and key informants are selected based on their indepth knowledge of the locality concerned (see Graph 19).
��