Texte extrait du document original pour l'indexation.
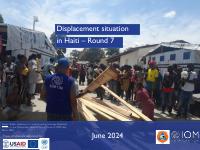
Displacement situation
in Haiti – Round 7
Cover: Shelter assistance in a school hosting Internally Displaced
Persons in the Metropolitan Area of Port-au-Prince © IOM Haiti,
March 2024
These activities are supported by :
June 2024
�CONTENT
OVERVIEW OF KEY RESULTS .............................................................................................................................................................................................................................. 3
AGE AND SEX DISAGGREGATION ................................................................................................................................................................................................................ 4
INTERNALLY DISPLACED PERSONS
IDPs’ HOST LOCATIONS ............................................................................................................................................................................................................... 5
IDPs’ ORIGINS .......................................................................................................................................................................................................................................... 7
REASONS FOR DISPLACEMENT ............................................................................................................................................................................................. 9
PERIOD OF DISPLACEMENT .................................................................................................................................................................................................... 10
FOCUS ON THE METROPOLITAN AREA OF PORT-AU-PRINCE (MAPAP) ...................................................................................... 11
FOCUS ON MUNICIPALITIES OF THE WEST OUT OF MAPAP..................................................................................................................... 15
FOCUS ON THE GREAT SOUTH ........................................................................................................................................................................................... 17
FOCUS ON THE CENTRE ............................................................................................................................................................................................................. 20
FOCUS ON ARTIBONITE .............................................................................................................................................................................................................. 22
FOCUS ON GREAT NORTH ....................................................................................................................................................................................................... 24
RETURNEES FORMERLY IDPs......................................................................................................................................................................................................................................... 26
�HAITI – MOBILITY TRACKING
June 2024
Internal displacement situation in Haiti – June 2024
1,069
OVERVIEW OF KEY RESULTS
This report aims to provide a holistic view of the internal displacement situation in Haiti. The Directorate General of Civil
Protection (DGPC) and the IOM’s Displacement Tracking Matrix (DTM) have been conducting periodic assessments of
locations hosting displaced populations since August 2022. Data is collected through direct observations as well as
interviews with key informants at the lowest administrative level, which is the neighborhood in the Metropolitan Area of
Port-au-Prince (MAPAP) and communal section outside the MAPAP.
578,074
Internally Displaced
Persons
+60%
80%
of IDPs in host
families
✓The Great South was the region that saw the largest increase in the number of IDPs hosted there (130% more
compared to Round 6). Nearly half (47%) of IDPs in the country are located in the Great South.
✓The majority of IDPs in the country are hosted in provinces: 68% in provinces vs. 32% in the MAPAP.
✓The IDPs in provinces are mainly people who fled the MAPAP: 78% of IDPs in provinces came from the MAPAP.
Artibonite, where half of the IDPs fled areas located in this department, is an exception. In all other departments of the
country, IDPs mainly came from the MAPAP.
✓In addition, 50,000 returnees formerly IDPs were identified, particularly in the MAPAP, in Croix-des-Bouquets (21%),
Cité Soleil (14%), Port-au-Prince (12%); in the South in Tiburon (19%); and in the Center in Sauts d’Eau (10%). It should
be noted that for the moment these returns remain very fragile and are not sustainable, particularly in the MAPAP.
interviewed key informants
Internally Displaced Persons (IDPs)
✓The last exercise of these assessments (Round 6 – published in early March 2024) indicated that 362,551 people were
internally displaced in Haiti. This new report indicates the presence of 578,074 internally displaced people, almost 60%
more than in Round 6. This increase is due to the deterioration of the security situation observed in the MAPAP, Haiti’s
capital, between the end of February and April 2024 in particular. The increase in the number of IDPs was more
identified in provinces where it increased by 95% (compared to 15% in the MAPAP). Indeed, following the increase in
violence in the MAPAP, many people fled the capital to seek refuge in provinces. Between 8 March and 9 April 2024,
IOM observed a flow of nearly 95,000 people fleeing the capital to go to the provinces, particularly to the Great South
(For more information, access the report dedicated to these flows).
✓At the national level, the majority of IDPs are hosted by host families: 80% vs 20% in sites. However, in the MAPAP,
the majority of IDPs reside in sites (61% in sites vs 39% in host families), while in provinces the opposite is true (97% in
host families vs 3% in sites). It is crucial to support host communities in provinces, particularly in the Great South, to
enable them to continue hosting IDPs; and it is important to promote social cohesion between these two population
groups. Without the resilience of host communities, the number of sites in provinces is likely to increase as has been the
case in the MAPAP. Indeed, at the beginning of the crisis, the majority of IDPs in the MAPAP were hosted by host
families: only about 2 out of 10 IDPs were in sites in 2022; this figure increased to 6 out of 10 IDPs in 2023. One of the
main reasons for this increase was the lack of resources of host communities to continue hosting IDPs and the
deterioration of social cohesion in this context.
3,980
assessed locations
Increase in the number of IDPs
compared to Round 6
20%
in sites
3
114
sites
96 in MAPAP (10 more than in round 6)
18 in provinces (11 more than in round 6)
52%
54%
of IDPs are women
(adults and minors)
of IDPs are children
IDPs’ period of displacement
1%
8%
10%
42%
39%
Before
2021
2021
2022
2023
2024
Returnees formerly IDPs
50,007
Returned persons
INTERNATIONAL ORGANIZATION FOR MIGRATIONS
Website: https://dtm.iom.int/haiti
Contact: dtmhaiti@iom.int
133,744
Displaced households
12,073
Returned households
The following citation is required when using the data and information included in this report: “International Organization for
Migration (IOM), June 2024, DTM Assessment of the displacement situation in Haiti. IOM Haiti. For more information on terms and
conditions for DTM reports and information products, please see: https://dtm.iom.int/terms-and-conditions.
�HAITI – MOBILITY TRACKING
June 2024
Internal displacement situation in Haiti – June 2024
RETURNEES’ AGE AND SEX DISAGGREGATION
IDPs’ AGE AND SEX DISAGGREGATION
Figure 1. IDPs’ age and sex disaggregation
60+
18 - 59
21%
12 - 17
6 - 11
Figure 3. Returnees’ age and sex disaggregation
5% 4%
Women
(54%)
60+
18%
10%
9%
8%
7%
18 - 59
Men
(46%)
6% 5%
6 - 11
<1
4% 3%
1-5
<1
Figure 2. Age and sex disaggregation of IDPs residing in sites
18 - 59
12 - 17
6 - 11
1-5
<1
26%
8%
Women
(51%)
Men
(49%)
4%4%
2%
9%
7%
8%
7%
7%
6%
Men
(46%)
5% 4%
Indeed, given the severity of living conditions in sites, IDPs often separate from their children,
preferring to send them to relatives in the MAPAP or in provinces. "As a proverb says (in
Creole): granmoun pa ret kay granmou (adults do not stay with other adults)", mentioned an
internally displaced household head residing in a site in the MAPAP, during the collection of
testimonies. "Our relatives did not have much space, nor the means to accommodate us for
a long time or to support us financially. So we had to leave them to come to this church",
explained another*.
8%
5% 5%
Women
(54%)
18%
More than half of IDPs (54%) are women (adults and minors) and 52% are children. The
proportion of internally displaced children is lower in sites: of all the IDPs residing in sites,
38% are children.
4%4%
28%
20%
12 - 17
1-5
60+
5% 4%
2%
* IDP testimonies on reasons for seeking refuge in sites rather than with host families, July 2023..
INTERNATIONAL ORGANIZATION FOR MIGRATIONS
Website: https://dtm.iom.int/haiti
Contact: dtmhaiti@iom.int
4
The following citation is required when using the data and information included in this report: “International Organization for
Migration (IOM), June 2024, DTM Assessment of the displacement situation in Haiti. IOM Haiti. For more information on terms and
conditions for DTM reports and information products, please see: https://dtm.iom.int/terms-and-conditions.
�HAITI – MOBILITY TRACKING
Internal displacement situation in Haiti – June 2024
June 2024
IDPs’ HOST LOCATIONS
Figure 5. Number and proportion of IDPs in their host regions
Figure 4. Host departments of IDPs
Host regions
Displaced
households
IDPs
% of IDPs
MAPAP
44,949
184,789
Outside
6,880
26,287
MAPAP
South
25,044
114,627
14,077
61,831
Great South South-East
(47%)
Grande'Anse
13,062
61,428
Nippes
7,254
30,566
Centre (7%)
Centre
9,478
40,753
Artibonite
Artibonite
7,680
34,952
(6%)
North
2,837
12,095
Great North
North-West
1,785
8,268
(3%)
North-East
698
2,478
TOTAL
133,744
578,074
Figure 6. Proportion of IDPs in host families and sites per host region
32%
West (37%)
Host regions
The majority of IDPs are hosted in provinces* (68%, compared to 32% in MAPAP). The 4
departments of the Great South (South, Nippes, Grande’Anse and South-East) host nearly
half of the country's IDPs (47%), particularly the South department, which hosts a fifth of the
country's IDPs.
West
Great
South
MAPAP
Outside
MAPAP
South
South-East
Grande'Anse
Nippes
Centre
The vast majority of IDPs in provinces are hosted by host families (97%). The 3% of IDPs in
provinces who are in sites were identified in 18 sites located in the West outside MAPAP (9 Centre
sites in the municipality of Léogâne, with 10,045 people), Artibonite (5 sites with 495 IDPs), Artibonite Artibonite
Nippes (3 sites with 208 people) and in the North-East (1 site with 53 people). In addition,
North
Grand
96 sites hosting 112,851 IDPs were identified in MAPAP.
North-West
North
North-East
* The term "province" refers to all areas of the country outside MAPAP
TOTAL
INTERNATIONAL ORGANIZATION FOR MIGRATIONS
Website: https://dtm.iom.int/haiti
Contact: dtmhaiti@iom.int
5
5%
20%
11%
11%
5%
7%
6%
2%
1%
<1%
100%
Total of
IDPs
IDPs in host
IDPs in sites
families
Number of
sites
184,789
39%
61%
96
26,287
62%
38%
9
114,627
61,831
61,428
30,566
40,753
100%
100%
100%
99%
100%
0%
0%
0%
1%
0%
0
0
0
3
0
34,952
99%
1%
5
12,095
8,268
2,478
578,074
100%
100%
98%
80%
0%
0%
2%
20%
0
0
1
114
The following citation is required when using the data and information included in this report: “International Organization for
Migration (IOM), June 2024, DTM Assessment of the displacement situation in Haiti. IOM Haiti. For more information on terms and
conditions for DTM reports and information products, please see: https://dtm.iom.int/terms-and-conditions.
�HAITI – MOBILITY TRACKING
Internal displacement situation in Haiti – June 2024
Figure 7. IDPs by municipality section (admin 2)
June 2024
Figure 9. Food security situation in IDPs host municipalities
Figure 8. IDPs by municipality section (admin 3)
On the acute food insecurity scale, the latest IPC* analysis in Haiti determined that, from
March to June 2024, all areas of the country are either in Phase 3 (Crisis) or Phase 4
(Emergency), which shows the severity of the food security situation in the country. 36% of
IDPs live in areas that are in Phase 4 and 64% in areas in Phase 3.
Figure 10. IDPs by IPC’s phase * The Phase 3 implies that households either: (i) have food consumption gaps
that are reflected by high or above-usual acute malnutrition; or (ii) are marginally
in their host locations
able to meet minimum food needs but only by depleting essential livelihood
368,049
(64%)
210,025
(36%)
assets or through crisis coping-strategies
The Phase 4 implies that households either: (i) have large food consumption
gaps which are reflected in very high acute malnutrition and excess mortality; or
(ii) able to mitigate large food consumption gaps but only by employing
emergency livelihood strategies and asset liquidation
Further information on the IPC can be found on https://www.ipcinfo.org
Phase 3
INTERNATIONAL ORGANIZATION FOR MIGRATIONS
Website: https://dtm.iom.int/haiti
Contact: dtmhaiti@iom.int
6
Phase 4
The following citation is required when using the data and information included in this report: “International Organization for
Migration (IOM), June 2024, DTM Assessment of the displacement situation in Haiti. IOM Haiti. For more information on terms and
conditions for DTM reports and information products, please see: https://dtm.iom.int/terms-and-conditions.
�HAITI – MOBILITY TRACKING
Internal displacement situation in Haiti – June 2024
June 2024
IDPs’ ORIGINS
Figure 11. IDPs by department of provenance (admin 1)
Figure 12. IDPs by municipality of origin (admin 2)
Figure 13. IDPs’ origins
Areas located in the West department represent the origin of almost all IDPs
(96%) while 3% came from the Artibonite department. This is due to the fact
that violence-related incidents are more frequent in the West department,
particularly in MAPAP. Of the 1,162 violence-related incidents recorded by the
Armed Conflict Location and Event Data Project (ACLED) from 2023 to 2024,
the majority took place in the West (79% - including 69% in MAPAP and 10%
outside MAPAP) and 12% in Artibonite (see Figure 17 on page 9).
Gressier
Tabarre
Cité Soleil
West (96%)
7%
1%
1%
1%
1%
Other
2%
Other
5%
Petite Rivière de
l'Artibonite
5%
Verrettes
8%
Other
11%
Delmas
Croix-Des-Bouquets
Port-au-Prince
15%
Carrefour
43%
Artibonite
(3%)
INTERNATIONAL ORGANIZATION FOR MIGRATIONS
Website: https://dtm.iom.int/haiti
Contact: dtmhaiti@iom.int
Other
(1%)
7
MAPAP represents the origin of 85% of IDPs in the country, particularly its
municipality of Port-au-Prince, where 43% of IDPs came from. It should be noted
that the municipality of Port-au-Prince is the one where the most incidents
related to violence have been recorded by ACLED (a quarter of incidents
observed in the country took place in this municipality).
The following citation is required when using the data and information included in this report: “International Organization for
Migration (IOM), June 2024, DTM Assessment of the displacement situation in Haiti. IOM Haiti. For more information on terms and
conditions for DTM reports and information products, please see: https://dtm.iom.int/terms-and-conditions.
�HAITI – MOBILITY TRACKING
June 2024
Internal displacement situation in Haiti – June 2024
Figure 14. Host and origin departments of IDPs
Figure 15. Departments of origin by host department
1%
Departments of
provenance
50%
100%
99%
100%
100%
100%
53%
100%
95%
South
100%
50%
47%
West
North-West
North
Artibonite
5%
Host departments
Figure 16. Host and origin municipalities of IDPs
IDPs in almost all departments came from the West department, particularly from
MAPAP: 78% of IDPs in provinces came from MAPAP. The Artibonite and NorthWest departments are those where a significant proportion of IDPs do not come from
the West department.
In Artibonite, half of IDPs came from this same department, this being due to violence
in certain areas of this department, making it the second in the country in the number
of violence-related incidents, after the West.
In the North-West, the areas bordering Artibonite are sometimes affected by attacks
by armed people coming from the latter department (especially from the municipality
of Gros Morne), forcing people to flee their residence.
INTERNATIONAL ORGANIZATION FOR MIGRATIONS
Website: https://dtm.iom.int/haiti
Contact: dtmhaiti@iom.int
8
The following citation is required when using the data and information included in this report: “International Organization for
Migration (IOM), June 2024, DTM Assessment of the displacement situation in Haiti. IOM Haiti. For more information on terms and
conditions for DTM reports and information products, please see: https://dtm.iom.int/terms-and-conditions.
�HAITI – MOBILITY TRACKING
Internal displacement situation in Haiti – June 2024
Figure 17. Violence-related incidents in municipalities of origin of IDPs
June 2024
REASONS FOR DISPLACEMENT
Figure 18. Reasons for displacement
IDPs’ reasons for displacement
%
Attacks / Violence
98%
Preventive displacement / Fear
1%
Difficulties in carrying out livelihood
activities due to insecurity
0,5%
Natural disaster
0,5%
Violence-related reasons were the reasons for displacement
for almost all IDPs in Haiti. Only 0.5% of those currently
displaced were displaced due to a natural disaster.
Data source on incidents : ACLED (Incidents from January 2023 to May 2024)
INTERNATIONAL ORGANIZATION FOR MIGRATIONS
Website: https://dtm.iom.int/haiti
Contact: dtmhaiti@iom.int
9
The following citation is required when using the data and information included in this report: “International Organization for
Migration (IOM), June 2024, DTM Assessment of the displacement situation in Haiti. IOM Haiti. For more information on terms and
conditions for DTM reports and information products, please see: https://dtm.iom.int/terms-and-conditions.
�HAITI – MOBILITY TRACKING
Internal displacement situation in Haiti – June 2024
PERIOD OF DISPLACEMENT
June 2024
Figure 20. Displacement year by municipality of origin
Figure 19. Displacement year
42%
39%
8%
10%
1%
Avant 2021
2021
Before
2021
2022
2023
2024
Figure 21. Displacement year by main municipalities of origin
Tabarre
67%
Artibonite
Ouest
West
Port-au-Prince 13% 6%
Gressier
46%
27%
Delmas 7%
2021
22%
38%
38%
51%
66%
26%
92%
2022
The year 2023 and the first half of 2024 are the major periods of displacement of persons who
are currently displaced, with respectively 42% and 39% of IDPs displaced during these periods. It is
important noting that 2024 is only half over and the number of IDPs displaced during this year is
already almost the same as the number of IDPs during the whole of 2023, indicating a growing
deterioration of the security situation during the first part of 2024.
37%
42%
Petite Rivière de l'Artibonite
Avant
Before2021
2021
35%
73%
34%
Croix-Des-Bouquets 3% 16%
1%
Carrefour 9%
2%
Verrettes 8%
It should be noted that periods of displacement are those of persons still displaced to date, without
taking into account persons who were displaced but have since returned home. As such, it does
not present the overall evolution or the cumulative number of displacements for a given year, but
rather reflects the periods marking the beginning of displacement of persons currently displaced.
33%
2023
7%
1%
2024
INTERNATIONAL ORGANIZATION FOR MIGRATIONS
Website: https://dtm.iom.int/haiti
Contact: dtmhaiti@iom.int
10
Nearly half (46%) of those who fled from areas located in the municipality of Port-au-Prince, the
main area of origin of IDPs in the country, were displaced in 2023 and 35% during the first half of
2024. The municipalities of Gressier and Carrefour are those from which the majority of IDPs fled
in 2024.
The following citation is required when using the data and information included in this report: “International Organization for
Migration (IOM), June 2024, DTM Assessment of the displacement situation in Haiti. IOM Haiti. For more information on terms and
conditions for DTM reports and information products, please see: https://dtm.iom.int/terms-and-conditions.
�HAITI – MOBILITY TRACKING
Internal displacement situation in Haiti – June 2024
Figure 22. Evolution of the number of IDPs in MAPAP since 2022
FOCUS ON THE METROPOLITAN AREA OF PORT-AU-PRINCE
Round 7
44 949
184,789
(June 2024)
Displaced households
Internally Displaced
Persons
Round 6
(March 2024)
in the number of IDPs
+15% Increase
compared to Round 6
Round 5
(Nov 2023)
39%
of IDPs in host families
61%
(10 sites more
96 than
in round 6)
in sites
June 2024
Round 4
(June 2023)
sites
+15%
184,789
Increased armed attacks by a coalition of different MAPAP gang groups and the resulting
widespread insecurity, pushing thousands of people to flee MAPAP to the provinces and others
to move between different neighborhoods within MAPAP.
146 584
+15% 160,550
After a relative decrease in security incidents in late 2023, the beginning of 2024 saw a significant increase in
these incidents, forcing more and more people to flee their homes. In particular, the attacks in Solino and
Gabelliste in January 2024 (see ETT 34.1), in Carrefour in January 2024 (ETT 35), in Pétion-ville, Port-au-Prince
and Cité soleil in January 2024 (ETT 36.1), in Carrefour, Cité Soleil and Tabarre in February 2024 (ETT 37.1).
+7% 139,853
143 209
The increase is mainly due to armed attacks that occurred in the Carrefour-Feuilles and SavanesPistaches neighborhoods in August 2023 (ETT 22.5)
+2% 130,884
Slight increase mainly due to flooding in early June 2023 (see ETT 18.3)
Round 3
(March 2023)
Figure 23. IDPs by host municipality in MAPAP
Municipalities
Displaced
households
Round 2
# of IDPs
% of IDPs
(Nov 2022)
Port-au-Prince
25,776
110,278
60%
Round 1
Delmas
Carrefour
12,064
2,415
45,903
9,589
25%
5%
(August 2022)
Croix-Des-Bouquets
1,505
6,218
3%
Tabarre
1,448
5,156
3%
Cité Soleil
989
3,963
2%
Pétion-Ville
752
3,682
2%
44,949
184,789
100%
TOTAL
-18% 127,977
This decrease was mainly due to a relative drop in security incidents in MAPAP at the end
of 2022 and the beginning of 2023. Thus, nearly 15,000 IDPs had returned home
between the two rounds.
+77% 155,166
This significant increase was due to the deterioration of the general situation in MAPAP
following sometimes violent social protest movements, particularly due to the increase
in the price of fuel.
87,895
Nearly 185,000 people are internally displaced in MAPAP, 15% more than in Round 6. The
municipality of Port-au-Prince hosts the majority of IDPs in MAPAP (60%), followed by Delmas
(25%). Unlike the situation in provinces, in MAPAP the majority of IDPs (61%) reside in sites. A total
of 96 sites have been identified in MAPAP hosting 112,851 IDPs (15% more than in Round 6). In
these sites, IDPs live in unsanitary conditions, in promiscuity and face health problems, stigmatization
and other protection and security risks.
Protection Cluster partners have collected information indicating that gangs have used IDPs in sites as
“shields” during attacks. For example, on 25 and 26 April 2024, more than 27 people were killed and
30 others injured, including IDPs residing in one site*.
* Protection Cluster Advocacy Note for the Protection of IDPs in Haiti,
May 2024
INTERNATIONAL ORGANIZATION FOR MIGRATIONS
Website: https://dtm.iom.int/haiti
Contact: dtmhaiti@iom.int
11
The following citation is required when using the data and information included in this report: “International Organization for
Migration (IOM), June 2024, DTM Assessment of the displacement situation in Haiti. IOM Haiti. For more information on terms and
conditions for DTM reports and information products, please see: https://dtm.iom.int/terms-and-conditions.
�HAITI – MOBILITY TRACKING
Internal displacement situation in Haiti – June 2024
June 2024
Figure 29. Evolution of the displacement situation in MAPAP from 2022 to 2024
MARCH 2024
JUNE 2024
NOVEMBER
2023
NOVEMBER
2022
INTERNATIONAL ORGANIZATION FOR MIGRATIONS
Website: https://dtm.iom.int/haiti
Contact: dtmhaiti@iom.int
12
The following citation is required when using the data and information included in this report: “International Organization for
Migration (IOM), June 2024, DTM Assessment of the displacement situation in Haiti. IOM Haiti. For more information on terms and
conditions for DTM reports and information products, please see: https://dtm.iom.int/terms-and-conditions.
�HAITI – MOBILITY TRACKING
June 2024
Internal displacement situation in Haiti – June 2024
Figure 24. IDPs in sites in MAPAP
IDPs are mainly concentrated in 20 sites (out of 96 sites): these 20 sites host 63%
of IDPs in sites in the MAPAP*.
In addition, it should be noted that at the start of significant displacement in the
MAPAP, in 2022, IDPs were more hosted by host families than in sites : at the end
of 2022, only a quarter of IDPs were residing in sites. A year later, at the end of
2023, the situation had reversed, with the majority of IDPs residing in sites (58%).
This trend continued in 2024 and currently, 6 out of 10 IDPs reside in sites (61%)
(see Figure 25).
In 2023, DTM collected testimonies to understand the reasons for this trend.
These testimonies had highlighted that limited resources of host families, as well as
the deterioration of social cohesion resulting from this problem of resources and
the generalized insecurity, were the main reasons**.
The sites in the MAPAP are concentrated in the commune of Port-au-Prince (60
of the 96 sites are located in this commune). Among the IDPs received in this
commune, 85% reside in the sites and 15% in host families.
Figure 26. IDPs in host families vs. in sites by host municipality
Figure 25. Evolution of the proportions of IDPs in host families vs in sites from 2022 to 2024
75%
36
25%
Round 1
(August
2022)
73
75%
50
58%
96
61%
58
51
25%
55%
62%
86
38%
45%
42%
39%
IDPs in sites
IDPs in host
families
IDPs in sites
# of sites
Port-au-Prince
110,278
15%
85%
60
Delmas
45,903
73%
27%
16
Carrefour
9,589
76%
24%
9
Croix-Des-Bouquets
6,218
100%
0%
0
39%
Tabarre
5,156
51%
49%
3
Cité Soleil
3,963
63%
37%
7
Pétion-Ville
3,682
79%
21%
1
184,789
39%
61%
96
TOTAL
* For further information see the list of sites
# of sites
INTERNATIONAL ORGANIZATION FOR MIGRATIONS
Website: https://dtm.iom.int/haiti
Contact: dtmhaiti@iom.int
# of IDPs
61%
Round 2
Round 3
Round 4
Round 5
Round 6
Round 7
(Nov 2022) (March 2023) (June 2023) (Nov 2023) (March 2024) (June 2024)
IDPs in host families
Municipalities
** For more details, access the report on these testimonies
13
The following citation is required when using the data and information included in this report: “International Organization for
Migration (IOM), June 2024, DTM Assessment of the displacement situation in Haiti. IOM Haiti. For more information on terms and
conditions for DTM reports and information products, please see: https://dtm.iom.int/terms-and-conditions.
�HAITI – MOBILITY TRACKING
Internal displacement situation in Haiti – June 2024
June 2024
Figure 28. IDPs by type of sites in MAPAP
Figure 27. Types of sites in MAPAP
Types of sites
# of sites
# of IDPs
% of IDPs
Schools
39
61,948
55%
Church /Temple
22
15,763
14%
Covered and fenced area
16
15,401
14%
Uncovered and fenced area
9
11,437
10%
Uncovered and unfenced space
10
8,302
7%
96
112,851
100%
TOTAL
Schools are the most used places in MAPAP to accommodate IDPs. A total of
39 schools are occupied by nearly 62,000 IDPs (i.e. 55% of IDPs in sites in
MAPAP). Churches accommodate 14% of IDPs in sites. Covered and fenced
spaces accommodate the same proportion. These are sites such as Parc Dix,
the premises of the Ministries of Education and Communication located in the
municipality of Port-au-Prince.
Uncovered (without roof) and unfenced spaces accommodate 7% of IDPs in
sites (i.e. 8,302 IDPs). IDPs in these spaces are more exposed to bad weather,
stray bullets and other risks.
INTERNATIONAL ORGANIZATION FOR MIGRATIONS
Website: https://dtm.iom.int/haiti
Contact: dtmhaiti@iom.int
14
The following citation is required when using the data and information included in this report: “International Organization for
Migration (IOM), June 2024, DTM Assessment of the displacement situation in Haiti. IOM Haiti. For more information on terms and
conditions for DTM reports and information products, please see: https://dtm.iom.int/terms-and-conditions.
�HAITI – MOBILITY TRACKING
Internal displacement situation in Haiti – June 2024
FOCUS ON MUNICIPALITIES IN THE WEST, OUTSIDE MAPAP
June 2024
Figure 30. IDPs’ host locations in areas of the West outside MAPAP
6,880
26,287
Displaced households
Internally Displaced
Persons
Decrease in the number of IDPs,
-25% compared to Round 6
9
38%
62%
of IDPs in host families
sites
in sites
(8 sites more
than in Round 6)
Figure 31. IDPs per host municipality in the West, outside MAPAP
Municipalities
Displaced
households
IDPs
% of
IDPs
# of sites
Léogâne
4,624
17,070
Anse à Galets
364
1,688
9 (hosting
10 045 IDPs)
6%
0
Pointe à Raquette
346
1,453
6%
0
Cornillon / Grand Bois
360
1,332
5%
0
Grand-Goâve
325
1,300
5%
0
Kenscoff
157
653
2%
0
Ganthier
139
541
2%
0
Thomazeau
85
415
Gressier
30
150
2%
1%
0
0
Autres communes
450
1,685
6%
0
6,880
26,287
100%
9
TOTAL
65%
INTERNATIONAL ORGANIZATION FOR MIGRATIONS
Website: https://dtm.iom.int/haiti
Contact: dtmhaiti@iom.int
A little over 26,000 people are internally displaced in areas located in the West department,
outside the MAPAP. This represents a decrease of 25% compared to Round 6. The municipality
of Ganthier hosted the most IDPs in these areas during round 6, particularly following the armed
attacks that occurred in December 2023 and February 2024 in some of its communal sections
(ETT 32.1 and 40). This muncipality then experienced a significant drop in the number of IDPs, as
the majority returned to their usual places of origin or took refuge in other areas of the country.
The municipality of Léogâne saw the number of IDPs hosted there increase by 230% between
Rounds 6 and 7. This is explained by the attacks of May 2024 in the municipality of Gressier
which pushed thousands of people to seek refuge in the neighboring municipality of Léogâne and
created sites there (ETT 42).
Among IDPs in the non-MAPAP areas of the West department, 70% came from these same
areas, notably from Gressier (33%) and Léogâne (19%).
15
The following citation is required when using the data and information included in this report: “International Organization for
Migration (IOM), June 2024, DTM Assessment of the displacement situation in Haiti. IOM Haiti. For more information on terms and
conditions for DTM reports and information products, please see: https://dtm.iom.int/terms-and-conditions.
�HAITI – MOBILITY TRACKING
Internal displacement situation in Haiti – June 2024
June 2024
Figure 32. Evolution of the displacement situation in non-MAPAP areas in the West, between Round 6 and Round 7
MARCH 2024
JUNE 2024
INTERNATIONAL ORGANIZATION FOR MIGRATIONS
Website: https://dtm.iom.int/haiti
Contact: dtmhaiti@iom.int
16
The following citation is required when using the data and information included in this report: “International Organization for
Migration (IOM), June 2024, DTM Assessment of the displacement situation in Haiti. IOM Haiti. For more information on terms and
conditions for DTM reports and information products, please see: https://dtm.iom.int/terms-and-conditions.
�HAITI – MOBILITY TRACKING
Internal displacement situation in Haiti – June 2024
June 2024
FOCUS ON THE GREAT SOUTH
The number of IDPs in the Great South increased by 131% compared to Round 6. This is the
region that has seen the largest increase in IDPs’ number in the country. When armed attacks
increased in MAPAP between March and April 2024, people fleeing MAPAP were mainly
heading to the Great South. Between 8 March and 9 April 2024, IOM observed a flow of nearly
95,000 people leaving MAPAP, the majority of whom were heading to the Great South (see the
report on MAPAP flows towards provinces).
59,437
268,452
Displaced households
Internally Displaced
Persons
in the number of IDPs
+131% Increase
compared to Round 6
99.9%
IDPs in host families
0.1%
in sites
Thus, the Great South is the leading region hosting IDPs in the country, with nearly half of the
country’s IDPs (47%). Among the four departments in this region, the South is the main
department hosting IDPs: 114,627 IDPs are located in this department, i.e 43% of IDPs in the
Great South and 20% of IDPs in the country.
more
3 than(1 site
in round 6)
sites
Figure 33. IDPs’ host locations in the Great South
La citation
suivante est
requise
lors de when
l’utilisation
des data
données
et informations
incluses
dans
ce rapport
: « Organisation
Internationale
The following
citation
is required
using the
and information
included
in this
report:
“International
Organization
for
pour les
Migrations
(OIM),
juin
2024,
Evaluations
deoflathe
situation
de déplacement
enHaiti.
Haïti.IOM
OIMHaiti.
HaïtiFor
» Pour
plus
d'informations
surand
les
Migration
(IOM),
June
2024,
DTM
Assessment
displacement
situation
in
more
information
on terms
17
1 termes et conditions des rapports et des produits d'informations DTM, veuillez consulter : https://dtm.iom.int/terms-and-conditions
conditions for DTM reports and information products, please see: https://dtm.iom.int/terms-and-conditions.
INTERNATIONAL
ORGANIZATIONPOUR
FOR LES
MIGRATIONS
ORGANISATION
INTERNATIONALE
MIGRATIONS
Website:
https://dtm.iom.int/haiti
Site web:
https://dtm.iom.int/haiti
Contact:
dtmhaiti@iom.int
Contact: dtmhaiti@iom.int
�HAITI – MOBILITY TRACKING
Internal displacement situation in Haiti – June 2024
June 2024
Figure 34. IDPs by host municipalities in the Great South
Departments
Municipalities
South
Les Cayes
Aquin
Torbeck
Cavaillon
7,900
2,365
2,000
1,932
32,203
12,020
10,000
9,663
12%
4%
4%
4%
0
0
0
0
Autres communes
10,847
50,741
19%
0
Jacmel
Bainet
25,044
8,104
1,822
114,627
30,782
6,855
43%
11%
3%
0
0
0
Autres communes
4,151
24,194
9%
0
Jérémie
Corail
14,077
3,287
2,298
61,831
15,844
9,888
23%
6%
4%
0
0
0
Autres communes
7,477
35,696
13%
0
13,062
61,428
23%
0
1,145
5,056
2%
0
1,080
606
4,790
2,633
2%
1%
0
3 (hosting 208 persons)
4,423
18,087
6%
0
7,254
59,437
30,566
268,452
11%
100%
3
3
Total South
South-East
Total South-East
Grande'Anse
Displaced households
Total Grande'Anse
Petite Rivière de
Nippes
Miragoâne
Anse-à-Veau
Nippes
Autres communes
Total Nippes
TOTAL GREAT SOUTH
# of IDPs
% of IDPs
# of sites
The figures for all municipalities and municipal sections are available in the dataset (accessible HERE).
INTERNATIONAL
ORGANIZATIONPOUR
FOR LES
MIGRATIONS
ORGANISATION
INTERNATIONALE
MIGRATIONS
Website:
https://dtm.iom.int/haiti
Site web:
https://dtm.iom.int/haiti
Contact:
dtmhaiti@iom.int
Contact: dtmhaiti@iom.int
1
18
La citation
suivante est
requise
lors de when
l’utilisation
des data
données
et informations
incluses
dans
ce rapport
: « Organisation
Internationale
The following
citation
is required
using the
and information
included
in this
report:
“International
Organization
for
pour les
Migrations
(OIM),
2024,
deoflathe
situation
de déplacement
enHaiti.
Haïti.IOM
OIMHaiti.
HaïtiFor
» Pour
d'informations
surand
les
Migration
(IOM),
June juin
2024,
DTMEvaluations
Assessment
displacement
situation in
moreplus
information
on terms
termes et
conditions
produits products,
d'informations
DTM,
https://dtm.iom.int/terms-and-conditions
conditions
for des
DTMrapports
reports et
anddes
information
please
see:veuillez consulter :
https://dtm.iom.int/terms-and-conditions.
�HAITI – MOBILITY TRACKING
Internal displacement situation in Haiti – June 2024
June 2024
Figure 35. Evolution of the displacement situation in the Grand Sud, between Round 6 and Round 7
JUNE 2024
MARCH 2024
INTERNATIONAL
ORGANIZATIONPOUR
FOR LES
MIGRATIONS
ORGANISATION
INTERNATIONALE
MIGRATIONS
Website:
https://dtm.iom.int/haiti
Site web:
https://dtm.iom.int/haiti
Contact:
dtmhaiti@iom.int
Contact: dtmhaiti@iom.int
La citation
suivante est
requise
lors de when
l’utilisation
des data
données
et informations
incluses
dans
ce rapport
: « Organisation
Internationale
The following
citation
is required
using the
and information
included
in this
report:
“International
Organization
for
les
Migrations
(OIM),
2024,
deoflathe
situation
de déplacement
enHaiti.
Haïti.IOM
OIMHaiti.
HaïtiFor
» Pour
d'informations
surand
les
Migration
(IOM),
June juin
2024,
DTMEvaluations
Assessment
displacement
situation in
moreplus
information
on terms
19
1 pour
termes et conditions des rapports et des produits d'informations DTM, veuillez consulter : https://dtm.iom.int/terms-and-conditions
conditions for DTM reports and information products, please see: https://dtm.iom.int/terms-and-conditions.
�HAITI – MOBILITY TRACKING
Internal displacement situation in Haiti – June 2024
June 2024
FOCUS ON THE CENTRE
9,478
40,753
Displaced households
Internally Displaced
Persons
+78%
Figure 36. IDPs’ host locations in the Centre
Increase in the number of IDPs
compared to Round 6
100%
of IDPs in host families
Figure 37. IDPs by host municipalities in the Centre
Municipalities
Displaced
households
# of IDPs
% of IDPs
Hinche
1,432
7,373
17%
Belladère
Thomonde
Boucan Carré
1,244
1,169
1,090
5,521
4,845
4,700
13%
12%
12%
Mirebalais
1,260
4,690
12%
Lascahobas
1,026
4,382
Maïssade
795
2,960
Thomassique
487
2,435
Cerca Carvajal
500
1,600
Saut d'Eau
251
1,255
Cerca La Source
135
630
11% With a 75% increase in the number of IDPs between Rounds 6 and 7, the Centre was the
7% second region with the highest increase after the Great South. All IDPs in this department came
6% from the West department: 93% from MAPAP, notably from the municipality of Croix-des
Bouquets (76%) neighboring the Centre department; 6% from the municipality of Thomazeau,
4%
which suffered armed attacks in February 2024 (ETT 38) and 1% from the municipality of
3%
Cabaret.
2%
Savanette
89
362
1%
9,478
40,753
100%
TOTAL
INTERNATIONAL ORGANIZATION FOR MIGRATIONS
Website: https://dtm.iom.int/haiti
Contact: dtmhaiti@iom.int
20
The following citation is required when using the data and information included in this report: “International Organization for
Migration (IOM), June 2024, DTM Assessment of the displacement situation in Haiti. IOM Haiti. For more information on terms and
conditions for DTM reports and information products, please see: https://dtm.iom.int/terms-and-conditions.
�HAITI – MOBILITY TRACKING
Internal displacement situation in Haiti – June 2024
June 2024
Figure 38. Evolution of the displacement situation in the Center between Round 6 and Round 7
MARCH 2024
JUNE 2024
INTERNATIONAL
ORGANIZATIONPOUR
FOR LES
MIGRATIONS
ORGANISATION
INTERNATIONALE
MIGRATIONS
Website:
https://dtm.iom.int/haiti
Site web:
https://dtm.iom.int/haiti
Contact:
dtmhaiti@iom.int
Contact: dtmhaiti@iom.int
21
La citation
suivante est
requise
lors de when
l’utilisation
des data
données
et informations
incluses
dans
ce rapport
: « Organisation
Internationale
The following
citation
is required
using the
and information
included
in this
report:
“International
Organization
for
pour les
Migrations
(OIM),
2024,
deoflathe
situation
de déplacement
enHaiti.
Haïti.IOM
OIMHaiti.
HaïtiFor
» Pour
d'informations
surand
les
Migration
(IOM),
June juin
2024,
DTMEvaluations
Assessment
displacement
situation in
moreplus
information
on terms
termes et
conditions
produits products,
d'informations
DTM,
https://dtm.iom.int/terms-and-conditions
conditions
for des
DTMrapports
reports et
anddes
information
please
see:veuillez consulter :
https://dtm.iom.int/terms-and-conditions.
�HAITI – MOBILITY TRACKING
Internal displacement situation in Haiti – June 2024
June 2024
FOCUS ON ARTIBONITE
7,680
34,952
Displaced households
Internally Displaced
Persons
+27%
Figure 39. IDPs’ host locations in Artibonite
Increase in the number of IDPs
compared to Round 6
99%
of IDPs in host families
1%
in sites
5
sites
(2 sites more
than in round 6)
Figure 40. IDPs by host municipality in Artibonite
Municipalities
Displaced # of
households IDPs
% of
IDPs
Verrettes
1,865 9,175
Saint-Marc
Gros Morne
Gonaïves
Dessalines
Saint-Michel de l'Attalaye
Anse Rouge
Marmelade
Grande Saline
Ennery
Desdunes
La Chapelle
Terre Neuve
Petite Rivière de l'Artibonite
L'Estère
TOTAL
1,869 8,554 23%
805 4,025 12%
665 3,365 10%
550 1,775
5%
415 1,755
5%
477 1,640
5%
195 1,000
3%
225
902
3%
154
624
2%
120
600
2%
110
550
2%
86
385
1%
84
322
1%
60
280
1%
7,680 34,952 100%
# of sites
25% 3 (hosting 330 IDPs)
0
0
0
0
1 (100 IDPs) Nearly 35,000 people are internally displaced in Artibonite, 99% of whom are in host families
0 and 1% in 5 sites. The municipalities of Verrettes and Saint-Marc host approximately half (48%)
0 of the IDPs in the department.
0
Half of IDPs in Artibonite came from areas located in the same department, particularly
1 (65 IDPs)
Verrettes (where 19% of the IDPs in Artibonite came from) and Petite Rivière de l’Artibonite
0
0 (17%).
0 The other half came from the West department: 34% from MAPAP and 16% from the
0 municipality of Cabaret.
0
5 (495 IDPs)
INTERNATIONAL ORGANIZATION FOR MIGRATIONS
Website: https://dtm.iom.int/haiti
Contact: dtmhaiti@iom.int
22
The following citation is required when using the data and information included in this report: “International Organization for
Migration (IOM), June 2024, DTM Assessment of the displacement situation in Haiti. IOM Haiti. For more information on terms and
conditions for DTM reports and information products, please see: https://dtm.iom.int/terms-and-conditions.
�HAITI – MOBILITY TRACKING
Internal displacement situation in Haiti – June 2024
June 2024
Figure 41. Evolution of the displacement situation in Artibonite between Round 6 and Round 7
MARCH 2024
JUNE 2024
INTERNATIONAL
ORGANIZATIONPOUR
FOR LES
MIGRATIONS
ORGANISATION
INTERNATIONALE
MIGRATIONS
Website:
https://dtm.iom.int/haiti
Site web:
https://dtm.iom.int/haiti
Contact:
dtmhaiti@iom.int
Contact: dtmhaiti@iom.int
1
23
La citation
suivante est
requise
lors de when
l’utilisation
des data
données
et informations
incluses
dans
ce rapport
: « Organisation
Internationale
The following
citation
is required
using the
and information
included
in this
report:
“International
Organization
for
pour les
Migrations
(OIM),
2024,
deoflathe
situation
de déplacement
enHaiti.
Haïti.IOM
OIMHaiti.
HaïtiFor
» Pour
d'informations
surand
les
Migration
(IOM),
June juin
2024,
DTMEvaluations
Assessment
displacement
situation in
moreplus
information
on terms
termes et
conditions
produits products,
d'informations
DTM,
https://dtm.iom.int/terms-and-conditions
conditions
for des
DTMrapports
reports et
anddes
information
please
see:veuillez consulter :
https://dtm.iom.int/terms-and-conditions.
�HAITI – MOBILITY TRACKING
Internal displacement situation in Haiti – June 2024
June 2024
FOCUS ON THE GREAT NORTH
5,320
22,841
Displaced households
Internally Displaced
Persons
99.8%
in host families
The Great North is the region hosting the fewest IDPs in the country (3%). Almost all of
these people are hosted by host families, except for 53 people residing in a site located in
the municipality of Sainte Suzanne in the North-East.
The majority of IDPs in this area came from the West (81%: 78% from MAPAP, 2% from
Léogâne and 1% from Cabaret).
The other part mainly came from the municipalities of Saint-Louis du Nord (13%), and
Bassin Bleu (2%) in the North-West. These communes often suffer attacks from gangs
coming from the neighboring commune of Gros Morne in the Artibonite department.
0.2%
in site
1
site
The Great North wasn’t assessed in Round 6
Figure 42. IDPs’ host locations in the Great North
INTERNATIONAL ORGANIZATION FOR MIGRATIONS
Website: https://dtm.iom.int/haiti
Contact: dtmhaiti@iom.int
24
The following citation is required when using the data and information included in this report: “International Organization for
Migration (IOM), June 2024, DTM Assessment of the displacement situation in Haiti. IOM Haiti. For more information on terms and
conditions for DTM reports and information products, please see: https://dtm.iom.int/terms-and-conditions.
�HAITI – MOBILITY TRACKING
Internal displacement situation in Haiti – June 2024
June 2024
Figure 43. IDPs by host municipalities in the Great North
Departments
Municipalities
North
Cap-Haïtien
882
4120
18%
0
Pilate
238
1,187
5%
0
Plaine du Nord
413
1,004
4%
0
Autres
communes
1,304
5,784
25%
0
2,837
12,095
53%
0
Saint-Louis du
Nord
672
2,916
13%
0
Jean Rabel
556
2,757
12%
0
Autres
communes
557
2,595
11%
0
1,785
8,268
36%
0
Ouanaminthe
193
866
4%
0
Caracol
64
320
1%
0
Sainte Suzanne
40
161
1%
1 (hosting 53 IDPs)
Autres
communes
401
1,131
5%
0
Total Nord-East
698
2,478
11%
1
TOTAL GREAT NORTH
5,320
22,841
100%
1
Total North
Nord-West
Total Nord-West
Nord-East
Displaced households
# of IDPs
% of IDPs
# of sites
The figures for all municipalities and municipal sections are available in the dataset (accessible HERE).
INTERNATIONAL
ORGANIZATIONPOUR
FOR LES
MIGRATIONS
ORGANISATION
INTERNATIONALE
MIGRATIONS
Website:
https://dtm.iom.int/haiti
Site web:
https://dtm.iom.int/haiti
Contact:
dtmhaiti@iom.int
Contact: dtmhaiti@iom.int
251
La citation
suivante est
requise
lors de when
l’utilisation
des data
données
et informations
incluses
dans
ce rapport
: « Organisation
Internationale
The following
citation
is required
using the
and information
included
in this
report:
“International
Organization
for
pour les
Migrations
(OIM),
2024,
deoflathe
situation
de déplacement
enHaiti.
Haïti.IOM
OIMHaiti.
HaïtiFor
» Pour
d'informations
surand
les
Migration
(IOM),
June juin
2024,
DTMEvaluations
Assessment
displacement
situation in
moreplus
information
on terms
termes et
conditions
produits products,
d'informations
DTM,
https://dtm.iom.int/terms-and-conditions
conditions
for des
DTMrapports
reports et
anddes
information
please
see:veuillez consulter :
https://dtm.iom.int/terms-and-conditions.
�HAITI – MOBILITY TRACKING
Internal displacement situation in Haiti – June 2024
June 2024
RETURNEES FORMERLY IDPs
50,007
Returned individuals
12,073
Returned households
110%
Increase in the number of
IDPs compared to Round 6
Figure 44. Return locations
Figure 45. Returned persons by area of return
Returned
# of
Area of return
% of returnees
households returnees
West
MAPAP
6,669
27,188
50%
Outside MAPAP
496
2,146
4%
South
2,680
10,638
21%
Centre
1,438
6,820
14%
Artibonite
596
2,476
5%
North-West
459
1,780
4%
North
231
1,105
2%
TOTAL
12,073
50,007
100%
Figure 46. Top 5 of municipalities of return
Municipalities Departments
Returned
households
# of
returnees
% of returnees
Croix-DesBouquets
Ouest
2,483
10,720
21%
Tiburon
Sud
2,440
9,615
19%
Cité Soleil
Ouest
1,670
6,883
14%
Port-au-Prince Ouest
1,706
6,159
12%
Data collection revealed 50,000 people who were internally displaced and who have returned to their
Sauts d'Eau Centre
1,032
5,160
10%
residence. Half of these people live in MAPAP, particularly in the municipality of Croix-Des-Bouquets
(21% of returnees in the country). The municipality of Tiburon in the South also hosts a significant
TOTAL
9,331
38,537
76%
number of returnees (19%). This municipality suffered gangs’ armed attacks in 2023* before a lull
returned and populations who had fled their residences returned. This was also the case in the municipality of Sauts d’Eau in the Centre (hosting 10% of returnees) where gang attacks
occurred in September 2023 (ETT 24) and February 2024 (ETT 38) before a relative lull returned and populations returned. It should be noted that these returns cannot be
considered durable because they are very fragile, particularly in the MAPAP. Testimonies from some returnees in the MAPAP revealed that some populations return to their areas of
residence, even though they are controlled by gangs because of threats from gangs to burn down their houses. These gangs often use populations of the areas they control as a
“shield” during clashes with the police. This tendency of gangs to push populations to return to areas they control could increase as the arrival of the multinational force in Haiti
approaches.
* https://lenouvelliste.com/article/245873/demantelement-de-gangs-19-presumes-bandits-abattus-a-tiburon
INTERNATIONAL ORGANIZATION FOR MIGRATIONS
Website: https://dtm.iom.int/haiti
Contact: dtmhaiti@iom.int
26
The following citation is required when using the data and information included in this report: “International Organization for
Migration (IOM), June 2024, DTM Assessment of the displacement situation in Haiti. IOM Haiti. For more information on terms and
conditions for DTM reports and information products, please see: https://dtm.iom.int/terms-and-conditions.
�In addition to this report, other information products are available to strengthen the
understanding of the displacement situation in Haiti:
✓ A summary dataset https://iomdtmhaiti.info/4e8GhbT
✓ A detailed dataset https://iomdtmhaiti.info/4aTT0vV : in addition to containing
data on the number of internally displaced persons and returnees, this dataset
contains sectoral data on several sectors: CCCM, Access to schools, access to
health facilities, Accountability, Water, Hygiene and Sanitation in spontaneous
sites, Access to markets, etc.
✓ An interactive map https://iomdtmhaiti.info/3TttIjr
✓ The list of spontaneous sites https://iomdtmhaiti.info/3RjtCsP
DTM.IOM.INT/Haïti
dtmhaiti@iom.int
June 2024
�