
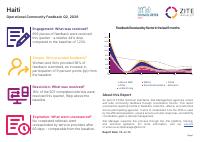
Haïti : analyse des retours communautaires et des orientations, avril à juin 2026
Résumé — Le Cluster CCCM en Haïti, co-dirigé par l'UCLBP, la DGPC et l'OIM, rend compte du mécanisme de retour d'information communautaire mis en oeuvre sur les sites de déplacement au deuxième trimestre 2026. Les partenaires ont reçu 692 retours au cours du trimestre, en baisse de 44 pour cent par rapport à une base de référence de 1 234. Les femmes et les filles ont fourni 58 pour cent des retours, en hausse de 9 points de pourcentage. Sur 507 orientations traitées, 16 pour cent ont été résolues au cours du trimestre, soit 16 points de pourcentage au-dessus de la référence. Le rapport suit l'usage du mécanisme par les personnes déplacées, la réponse des prestataires et les lacunes de coordination dans la gestion des orientations.
Constats Clés
- 692 retours communautaires reçus au deuxième trimestre 2026, en baisse de 44 pour cent par rapport à une base de 1 234.
- Les femmes et les filles ont fourni 58 pour cent des retours, 9 points de pourcentage au-dessus de la référence.
- 16 pour cent des 507 orientations traitées ont été résolues durant le trimestre, 16 points au-dessus de la référence.
- Le mécanisme est géré par les agences de gestion de sites selon les standards minimaux CCCM.
- Le Cluster est co-dirigé par l'UCLBP, la DGPC et l'OIM.
Texte Intégral du Document
Texte extrait du document original pour l'indexation.
Haiti
Operational Community Feedback Q2, 2026
Engagement: What was received?
692 pieces of feedback were received
this quarter - a relative 44% drop
compared to the baseline of 1,234.
Feedback Received by Sector in the last 6 months
1600
1400
1200
1000
People: Who provided feedback?
Women and Girls provided 58% of
feedback submitted, an increase in
participation of 9 percent points (pp) from
the baseline.
Resolution: What was resolved?
16% of the 507 completed referrals were
resolved this quarter, 16pp above the
baseline.
Expiration: What went unanswered?
No completed referrals went
unresponded by service providers after
60 days - comparable from the baseline.
800
600
400
200
0
Jan
Feb
Abris & AME
Other
6-Month Avg
Mar
Apr
WASH
Sécurité Alimentaire
May
Jun
Santé
Education
About this Report
As part of CCCM minimum standards, Site Management agencies collect
and refer community feedback through coordination forums. This report
summarizes quarterly trends in feedback collection, referral, and outcomes
across participating agencies. It aims to understand how the CFM is used
by the affected population, unpack service provider responses, and identify
coordination gaps in referral management.
Zite Manager supports this process through the Zite platform, training,
and technical guidance. For more information, visit our website
or email us at zitemanager@iom.int.
Report Date: 08 Jul 26
Page 1
Program & Context Overview
About the CCCM Program:
CFM Coverage Map: IDP Sites, SM Leads & Feedback Received
The CCCM Cluster in Haiti, co-led by UCLBP, DGPC, and IOM, coordinates site
management and support for displaced populations in a context marked by
insecurity, sudden displacement, and growing humanitarian needs. Cluster
partners work in collective centres, spontaneous sites, with IDP-hosting families,
and in host communities in heavily affected areas, using static, mobile, remote, and
area-based approaches depending on access constraints.
During the quarter, seven partner agencies operated the CFM across 60 sites. IOM
recorded the highest volume of feedback (188 across 10 sites), followed by ATREPA
(177 across 12 sites), ASHAPE (113 across 4 sites), APRONHA (86 across 6 sites),
ICDH (71 across 11 sites), ACTED (35 across 14 sites), and CESVI (5 across 3 sites).
Context:
Haiti's humanitarian situation in 2026 and in this quarter, continues to deteriorate as
escalating armed violence, widespread displacement, and constrained humanitarian
access drive increasing needs across the country. Armed groups continue to
expand their influence, particularly across the Port-au-Prince metropolitan area and
parts of Artibonite, disrupting population movements, limiting access to essential
services, and increasing protection risks for affected communities.
Displacement remains one of the primary drivers of humanitarian need, with
approximately 1.5 million people internally displaced across Haiti. Ongoing
insecurity has placed significant pressure on host communities, displacement
sites, and already overstretched basic services, while many households continue
to face repeated displacement.
Humanitarian operations remain challenged by insecurity, movement restrictions,
and logistical constraints that limit access to affected populations and the delivery
of assistance. At the same time, humanitarian needs continue to outpace available
resources. An estimated 6.4 million people require humanitarian assistance, while
funding shortfalls continue to reduce the scale and predictability of the response.
Total feedback by Area
Implemented in Country by
Page 2
Methodology
What does this report cover?
New feedback is received daily and existing referrals progress at different rates
through the CFM cycle. This makes it difficult to take an accurate snapshot at
any given moment and compare timeperiods. To ensure clear, reproducible,
and enable non-duplicated comparisons, the analysis is based on when actions
were completed within the quarter.
Engagement: What feedback was received?
•
Received Feedback: A record of all non-sensitive operational feedback
received during the reporting period. This helps us understand who is
engaging with the CFM and what feedback they are providing.
Key Indicator: # of tickets received by sector & location.
•
Completed Referrals: refers to fully processed referrals. The date of
completion is marked by when the results are communicated back to the
feedback submitter. The results of referrals are only analysed in the quarter
they were completed—not when first received—to assess how referrals are
managed.
Baseline Comparison: To understand performance, this quarter's results are
compared to a 12-month weighted quaterly average, calculated from the past
four quarters prior to the current one.
•
•
•
When comparing overall counts (e.g. total feedback or feedback from
women), the relative percentage change from baseline is used, written as
"+/– 2%" .
When comparing percentages (e.g. % expired), we show the change in
percentage points, written as "2pp".
Percentages in brackets (2%) simply show the current share of a total, not
a baseline comparison.
All figures and charts are auto-generated through linked Python tools.
Limitations:
•
The report excludes emergency & sensitive feedback (e.g. Code of Conduct
or protection cases). Sensitive feedback is referred directly via protection
pathways. Only the protection focal point’s contact details are recorded.
•
Community feedback reflects engagement with the CFM, not a representative
assessment of population needs.
•
Actions not recorded in the CFM system or reported to CCCM are not
captured. Findings reflect only what was processed through the CFM and
should not be used to assess sector performance or service quality.
•
This report highlights key results only; some metrics may be excluded if
data is insufficient.
Covers the feedback received by Sector, location and topic
and whether this feedback was referred or closed upon
receipt.
People: Who shared feedback?
Includes who is providing feedback, broken down by
demographic information, like sex, age, vulnerability, and
disability.
Key Indicator: Sex, Age, & Vulnerability disaggregated
feedback.
Resolution: What referrals were resolved?
Explores what referrals were reported resolved by service
providers and, if they were not resolved, the reason why they
couldn’t be resolved. Only referrals completed within the
quarter are analysed.
Key Indicator: % of feedback reported resolved by sector &
location.
Expiration: What referrals went unanswered?
Not all completed referrals receive a response from service
providers. These "expired" referrals are reported on by Sector
and location.
Key Indicator: % of feedback expired by sector & location.
Interested in learning more? See our methods note and previous reports.
Page 3
Engagement: What Feedback was Received?
This quarter, 692 feedback entries were received, representing a 44% decrease compared with the baseline and noticeably less than last quarter which
received 2,408. The vast majority of feedback (98%) consisted of requests for assistance, services, or repairs, while the remaining 2% were general
questions about assistance. As the CFM programme is still relatively new, comparisons with the baseline should be interpreted with caution. Large
percentage changes can occur in locations that have historically received relatively few referrals. For example, sites in Boucan Carré recorded the largest
increase in feedback volume compared with the baseline.
Abris & AME (Shelter & NFIs) and Sécurité Alimentaire (Food Security) received the highest number of referrals overall, largely driven by sites in Portau-Prince. However, referral patterns differed across communes in central Haiti. In Thomonde, Education was the most frequently reported sector, with
referrals primarily relating to families being unable to afford school fees. In Hinche, a higher proportion of referrals concerned Sécurité Alimentaire,
driven mainly by requests for income-generating activities.In Delmas, the vast majority of feedback related to Abris & AME, particularly requests for
"Appui au loyer / Rental Assistance requested".
Despite the overall decline in feedback volume, requests for BNA kits (NFI kits) increased this quarter. This rise was driven primarily by Site Kid in Portau-Prince, which accounted for 86% of all BNA kit requests.
Sectors receiving most feedback this quarter
Locations with Biggest Baseline Changes
212 (31%)
24 | +2300%
Abris & AME
200 (29%)
Sécurité Alimentaire
109 (16%)
WASH
49 | +444%
Boucan Carré
Top 6 Topics of Feedback
7 | -79%
Belladére
Pétion-Ville
Most Feedback by Top Locations & Sector
Activités génératrices de revenus
Sécurité
Abris & AME Alimentaire
-27%
Kit BNA
+185%
Appui au loyer
-86%
École
-36%
Distribution monétaire
WASH
Education
Santé
Other
Port-au-Prince
127
117
58
16
34
15
Hinche
21
50
9
16
3
4
Delmas
45
10
14
3
8
6
Thomonde
5
2
8
23
2
12
Belladère
9
12
15
7
2
4
Boucan Carré
4
6
4
8
2
0
-88%
Hôpital
-31%
0
20
40
60
80
100
Total Feedback Received & relative -/+ pct from baseline
120
140
Page 4
People: Who Provided Feedback?
Most feedback this quarter was submitted through CCCM Staff (82%), followed by Boîte
à suggestion (7%) and Community Leaders (6%). Feedback submitted by Community
Leaders was notably lower than the baseline, decreasing by 9 percentage points. The
majority of feedback (72%) was submitted pour elle-même (on behalf of oneself), while
21% represented l'ensemble du site (the entire site) and 5% was submitted pour un groupe
de personnes ou une communauté (on behalf of a group of people or a community).
274 (40%) | -43%
Women & Girls
535 (77%) | -49%
Men & Boys
7%
398 (58%) | -44%
5%
Across all demographic groups, the most common request related to Activités génératrices
de revenus (income-generating activities). However, there were some notable differences
between groups. Women and girls submitted a higher proportion of feedback relating to
Abris & AME (Shelter & NFIs) than men and boys, while men and boys submitted a greater
proportion of feedback relating to WASH. Persons with disabilities and older people also
recorded proportionally higher rates of referrals relating to Santé (Health).
Feedback Channels
CCCM Staff
Boite à suggestion
82%
Vulnerable Households
Community Leaders
Group Meeting or Activity
Other
64 (9%) | -43%
Persons with Disabilities
Feedback Received by Gender, Vulnerability & PwD
Men & Boys
8%
7%
8%
27%
28%
22%
Women & Girls
33%
12% 6% 8%
30%
10%
Vulnerable Households
28%
11%
7%
8%
31%
14%
Persons with Disabilities
27%
6%
14%
22%
25%
0
6%
100
200
WASH
Sécurité Alimentaire
300
Santé
Other
400
Education
500
Abris & AME
Page 5
Resolution: What Referrals were Resolved?
Of the 507 completed referrals, 16% were successfully resolved, as reported
by service providers. The overall resolution rate increased by 16 percentage
points compared with the baseline. Referrals relating to Kit BNA (NFI kits)
and Eau de Boisson (Drinking Water) recorded the highest resolution rates,
with 71% of 31 referrals and 64% of 11 referrals resolved, respectively.
The majority (84%) of completed referrals were reported as unresolved
by service providers, a 16 percentage point decrease compared with the
baseline. Sites in Belladère and Pétion-Ville recorded the highest unresolved
referral rates, with all referrals marked as unresolved. The most common
reasons in those locations were were "Future Considerations", and "No
reason recorded."
507 | +745%
65 days | 2 days slower
Completed Referrals
Service Provider Responses to Referrals
250
200
150
100
50
0
Jan
Feb
Resolved
Mar
Other
Unreachable
Apr
May
No reason recorded
6-Month Avg
Average Response Time
Completed Referrals Results Compared to Baseline
Top reasons feedback goes unresolved
82 (16%)| +16pp
385 (76%)
Resolved
Jun
425 (84%)| -16pp
Unresolved
0 | 0pp
No reason recorded
Expired
17 (3%)
9 (2%)
Unreachable
Can't Technically
Resolve
Completed Referral Results by Top Locations
Results by Sector
WASH
+14pp
Unresolved
Resolved
Expired
Port-au-Prince
178 (76%)
57 (24%)
0 (0%)
Hinche
120 (100%)
0 (0%)
0 (0%)
Delmas
108 (95%)
6 (5%)
0 (0%)
Pétion-Ville
16 (46%)
19 (54%)
0 (0%)
Belladère
3 (100%)
0 (0%)
0 (0%)
-14pp
Santé
+0pp
Education
+2pp
-2pp
Other
+5pp
-5pp
Abris & AME
+29pp
-29pp
Sécurité Alimentaire
+16pp
0
20
-16pp
40
60
-/+pp from baseline
80
100
120
Expired
Unresolved
Resolved
140
160
Page 6
All Sectors
Received
Referred
Completed
Referrals
Abris & AME
212 | -60%
212 (100%)
153 | +993%
45 (29%)
108 (71%)
0 (0%)
Sécurité Alimentaire
200 | -51%
200 (100%)
149 | +1142%
24 (16%)
125 (84%)
0 (0%)
WASH
109 | +35%
108 (99%)
79 | +558%
11 (14%)
68 (86%)
0 (0%)
Education
73 | -34%
72 (99%)
42 | +4100%
1 (2%)
41 (98%)
0 (0%)
Santé
54 | -21%
54 (100%)
65 | +282%
0 (0%)
65 (100%)
0 (0%)
CCCM
19 | +3%
19 (100%)
7 | +75%
1 (14%)
6 (86%)
0 (0%)
Nutrition
16 | +100%
16 (100%)
11 | +0%
0 (0%)
11 (100%)
0 (0%)
Protection
9 | +50%
9 (100%)
1 | +0%
0 (0%)
1 (100%)
0 (0%)
Resolved
Unresolved
Expired
Page 7
All Locations
Received
Referred
Completed
Referrals
Port-au-Prince
367 | -60%
365 (99%)
235 | +343%
57 (24%)
178 (76%)
0 (0%)
Hinche
103 | -69%
103 (100%)
120 | +0%
0 (0%)
120 (100%)
0 (0%)
Delmas
86 | -29%
86 (100%)
114 | +1529%
6 (5%)
108 (95%)
0 (0%)
Thomonde
52 | +0%
52 (100%)
0 | +0%
0 (0%)
0 (0%)
0 (0%)
Belladère
49 | +444%
49 (100%)
3 | +0%
0 (0%)
3 (100%)
0 (0%)
Boucan Carré
24 | +2300%
24 (100%)
0 | +0%
0 (0%)
0 (0%)
0 (0%)
Pétion-Ville
7 | -79%
7 (100%)
35 | +0%
19 (54%)
16 (46%)
0 (0%)
Cité Soleil
2 | +0%
2 (100%)
0 | +0%
0 (0%)
0 (0%)
0 (0%)
Léogâne
2 | +0%
2 (100%)
0 | +0%
0 (0%)
0 (0%)
0 (0%)
Resolved
Unresolved
Expired
Page 8
Comment citer
Camp Coordination and Camp Management Cluster (CCCM Cluster), Haïti : analyse des retours communautaires et des orientations, avril à juin 2026, https://reliefweb.int/node/4224959