
UrDI zone de Canaan : plan de quartier pour Canaan III
Résumé — Ce document UrDI d'ONU-Habitat fait partie du paquet de planification 2016 pour la zone de Canaan, Port-au-Prince. Il fournit une analyse urbaine, des orientations de planification ou des propositions de quartier pour Canaan III dans l'extension métropolitaine de Croix-des-Bouquets.
Constats Clés
- Ajoute une couverture de planification UrDI pour Canaan III.
- Relie la croissance de l'habitat à l'utilisation du sol, aux infrastructures et aux risques.
- Fait partie du paquet de planification 2016 pour la zone de Canaan.
- Classé sous Croix-des-Bouquets/Ouest plutôt que sous la commune de Port-au-Prince.
Description Complète
Préparé dans le cadre de l'Initiative de développement urbain pour la zone de Canaan, le document traite de la croissance urbaine rapide, de l'utilisation du sol, des infrastructures, des risques et de la planification de l'habitat à Canaan III et autour de cette zone. Il doit être lu avec le diagnostic, le cadre stratégique et le plan de structure urbaine de Canaan.
Texte Intégral du Document
Texte extrait du document original pour l'indexation.
UrDI - Urban Structure Plan
3.3. CANAAN III
1
2
No-Built areas
3
4
Section D
5
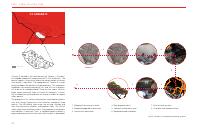
Canaan III, located in the southern part of Canaan, is the densest neighbourhood with a population of 22,413 inhabitants. The
densest region is the centre where the concentration of houses
and services is abundant. The topography of Canaan III is moderate and opens the possibility for development. This neighbourhood does not face environmental risks and thus has the potential to be a rich neighbourhood. There are few sports facilities,
public spaces and small shops in Canaan III, however it is essential to keep ensuring the provision of services in order to support
urban growth.
The proposals in this section are based on a participatory process
with the Canaan II community that lasted an average of three
months. The UN-Habitat team maps the existing situation and
then the community validates and proposes ideas. The LAB of
urban planning and design checks the proposed interventions
and modifies if necessary. Then, a neighbourhood assembly is
organized to present the vision and a land use plan is developed.
4.Reforestation
3.
4.
8
8.
7
3.
5.
2.
2.
6.
6
1.
7.
1.Reforestation
10.
1.
1.
15.
11.
12.
16.
9.
30.
17.
13.
29.
14.
18.
28.
27.
35.
34.
19.
26.
31.
20.
32.
33.
21.
25.
23.
24.
22.
0
500
1000m
1. Mapping the existing situation
4. New proposals draft
7. Draft of land use plan
2. Mapping proposed interventions
5. Selected interventions map
8. Charrette and implementation
3. Community workshops
6. Neighbourhood assemblies
Fig.88: Canaan III: participatory planning process
82
U r b a n D e v e l o p m e n t I n i t i a t i v e ( U r D I ) f o r C a n a a n a r e a o f Po r t - A u - P r i n c e
A. STREET NETWORK
Improving the road network is essential to prevent congestion and traffic, this will help promote
connectivity and reduce car dependency. Also, preserving spaces for streets is important before
it is too late. There a two national roads that extend along the eastern and western limits of the
neighbourhood.
Two arterial roads that link several main streets are proposed, as well as secondary streets that
interconnect settlements are also suggested. The LAB, with its new proposal, reached an increase
in the percentage of street network from 11% to 31%. The new plan does not only suggests the
creation of new roads, but also aims to improve the current situation by enlarging the streets for
example. Different widths are defined for the different types of roads (Option A and B, see below).
Existing situation
Proposed street network
Streets percentage
Streets percentage
UN-Habitat: 30%
31% -Option A
Arterial road: 24m
Main roads: 18m
Secondary streets: 12m
11%
- Option B
Arterial road: 18m
Main roads: 12m
Secondary streets: 9m
Streets km/sq.km
UN-Habitat: 18 km/sq.km
18.48 km/sq.km
Fig.89: Canaan III: existing street network
Fig.90: Canaan III: Proposed street network
Layers of the proposed street network
National road
Arterial road
Main roads
Secondary streets
Fig.91: Canaan III: Layers of the proposed street network
83
UrDI - Urban Structure Plan
B. PUBIC SPACES
Existing Public Spaces
Fig.92: Canaan III: Existing Public spaces
#
PUBLIC SPACES IN CANAAN III
STATUS
NAME
Area of the neighbourhood
Fig.93: Canaan III: Public spaces proposed by the community
m2
Ha
%
3.269.000
327
100%
1
Public space
Existing
3.100
0,31
2
Public space
Existing
757
0,07
3
Public space
Existing
3.014
0,3
4
Public space
Existing
830
0,08
5
Public space
Existing
2.760
0,27
6
Public space
Existing
2.340
0,23
12.801
1,28
2.883
0,28
7
Public space
Proposed by the community
15
Public space
Proposed by the community
8
Public space
Proposed by the community
9
Public space
Proposed by the community
Proposed by UN-Habitat LAB
Proposed by the community
Ecole Fondamentale de Canaan
Place Delivrance
Place Publique De Canaan
580
0,05
1153
0,11
2.295
0,22
6.911
0,69
10
Public space
Proposed by the lab
491
0,04
11
Public space
Proposed by the lab
556
0,05
12
Public space
Proposed by the lab
720
0,07
13
Public space
Proposed by the lab
500
0,05
14
Public space
Proposed by the lab
0,39%
0,21%
400
0,04
2.667
0,26
0,08%
22.379
2,23
0,68%
Table 11. Canaan III: Percentage of public spaces
84
Fig.94: Canaan III: Public spaces proposed by UN-Habitat LAB
Currently, there are some public spaces in Canaan III that covers
0.3% of the total neighbourhood area. UN-Habitat recommends
a coverage of 15% of public spaces. This recommendation implies that these spaces are spread equitably in the neighbourhood. Most of the existing public spaces are concentrated in
the centre and therefore a decentralization of these spaces is
essential. Ideally they should be easily accessible and located at a
maximum distance of 400 metres to reduce car dependency and
improve walkability.
During the participatory assemblies, the community strongly expressed its need to improve the green network. The results after the new public spaces propositions shows an increase in the
percentage of these spaces, and also a good distribution in the
neighbourhood. The amount of public space remains low and
could be further improved. To meet the demands of the growing
population, ways must be found to preserve more land for public
purposes.
U r b a n D e v e l o p m e n t I n i t i a t i v e ( U r D I ) f o r C a n a a n a r e a o f Po r t - A u - P r i n c e
It is important to guarantee from both sides of the ravine, a distance 50m as a buffer zone. These zones were designed with
the potential of becoming public spaces and not just protection
areas. If these proposals are put into place, the allocated public
space in Canaan III will reach 1.4% ensuring 2m2 of space per
inhabitant.
Proposed public spaces with 400 metres buffer
Existing public spaces
Proposed by the community
Proposed by UN-Habitat LAB
The total number of public spaces remains low and can be further enhanced. More spaces should be considered or preserved
for public usages in order to meet the demand of the growing
population.
#
PUBLIC OPEN SPACES
IN CANAAN III
m2
Ha
Neighbourhood area
3.269.000
327
100%
Public spaces
22.379
2
0.68%
NAME
STATUS
%
16
Buffer area next to
ravine
Proposed by lab
13.968
1,39
17
Buffer areas next to
ravine
Proposed by lab
9.636
0,96
23.604
2
0,72%
45.983
4,59
1.40%
Total:
Total Public open spaces:
Table 12. Canaan III: Total percentage of open public spaces
The World Health Organization (WHO) recommends 9m2/inhabitant
Existing
Proposed
public space
Proposed
P.S + non-aedificandi
12.800 m2
22.379 m2
45.983 m2
22.413 inhabitants
22.413 inhabitants
22.413 inhabitants
2
0,57 m /inhabitant
2
0,99 m /inhabitant
2 m2/inhabitant
Table 13. Canaan III: Public space area per inhabitant diagram
Fig.95: Canaan III: Overall public spaces’ land use and buffer area (400m)
85
UrDI - Urban Structure Plan
C. RESIDENTIAL AREAS
3.27 km2
Proposed densities
Neighbourhood area
22,413
Inhabitants
Low density
Low density housing are suggested where the topography is not
complex. With reference to the map on the right, the northern
part of Canaan III was designated for low densities where it is
proposed to have 8,000 inhabitants per square kilometre. Existing homes may remain, although it is recommended not to
further densify the site.
(source ARC household survey 2016)
6,854
People/km2
Existing residential areas
Fig.97: Canaan III: Projected population increase
Medium density
The topography where medium density housing is proposed, is
abrupt but still considered suitable for dwellings. The level of
densification depends on the proximity of the arterial and main
streets, as well as the commercial and the service-oriented areas.
The in-between areas of the most urbanized and the low density
areas are therefore recommended to be of average density with
12,000 people per square kilometre.
High density
Fig.96: Canaan III: Existing settlements
Canaan III is the densest among the 15 neighbourhoods of Canaan. This is due to the fact that it is situated in the most urbanized areas and with flat topography.
86
Fig.98: Canaan III: Contours
Located just at the entrance of Canaan, the neighbourhood has
a strategic location with a great potential and opportunities for
development. The population growth of Canaan III is of 4% per
year.
High density areas with 15,000 people per square kilometre are
advised to take place near the arterial roads. The southern region
that is between the RN 1 and the proposed arterial road is to become a completely high density area. It is preferable to combine
high residential densities with commercial services with the aim
of promoting a mixity of usages. In Canaan III, this was proposed
in the central parts of the district, extending horizontally to the
north and south. This encourages a compact urban form and
also reinforce the urban economic and the social and cultural
activities.
U r b a n D e v e l o p m e n t I n i t i a t i v e ( U r D I ) f o r C a n a a n a r e a o f Po r t - A u - P r i n c e
Fig.99: Canaan III: Diagram of population in the new proposed
residential areas.
In the plan of Canaan III, the residential areas must not be monofunctional; the integration of mixed uses into the urban fabric
is essential to promote walkability, encourage the inclusion of
vulnerable people and maintain social cohesion. In 20 years, and
if the growth remains of 4%, the current population of 22,400
will reach 49,000 people.
The densification of Canaan III, as proposed, will accommodate
22,470 inhabitants. In order to meet the demands of the growing population, further densification will be required as well as
the consideration of an extension plan for the region.
Low density
Medium density
High density
Fig.100: Canaan III: Residential areas and proposed densities
87
UrDI - Urban Structure Plan
D. COMMERCIAL AREAS
Existing commercial
Proposed commercial areas (mixed-use)
231
8.5%
Existing
commercial
points
(of the total
neighbourhood area)
(source OSM)
Fig.101: Canaan III: Existing commercial points (Source: OSM)
Fig.102: Canaan III: Proposed commercial areas
The commercial activities are found dispersed in the neighbourhood with little concentration.
The shops are of different utilisations like vegetable shops, tailor, etc… In order to keep with
the urban growth of 4%, it is essential to provide further commercial activities and encourage
commercial streets. The decentralization of these services and the good planning of street
network will increase employment opportunities for the residents.
After the community workshops, different commercial roads were identified. The location of
these services was concentrated near the main roads, as well as the arterial roads. This will
ensure that they are easily accessible. Commercial services are catalysts for local economy. It
is important to note that these services are not monofunctional and are not limited to commerce but open space for different functions to be present. The new commercial will occupy
8.5% in the new land use plan of Canaan III.
88
0
500
1000m
U r b a n D e v e l o p m e n t I n i t i a t i v e ( U r D I ) f o r C a n a a n a r e a o f Po r t - A u - P r i n c e
E. PUBLIC FACILITIES
There are 85 plots for schools in Canaan III. These schools are well
distributed in the neighbourhood and can support the population growth of the neighbourhood. The data has been validated
with the community, however there is always lack of information
concerning the types of facilities (primary, secondary, etc.). In
consequence, no new school is proposed, but the upgrading of
the current facilities and the quality of the educational program
is recommended.
RELIGIOUS - EXISTING
EDUCATION - EXISTING
HEALTH - EXISTING
OTHER PUBLIC FACILITIES - EXISTING
Fig.103: Canaan III: Existing public facilities
and a 500m buffer catchment area.
16%
Less than 10 years
3%
Illiterate
27%
Primary school (not finished)
10%
Primary school (finished)
31%
Secondary school (not finished)
8%
Secondary school (finished)
2%
Professional school
3%
University
Table 14. Canaan III: Participation level (Croix Rouge Americaine,
Juillet 2016)
The neighbourhood has 79 worship places. The frequency of
these services follows the density of the population. Where the
density is high, the religious facilities are found abundant and
vice versa. There are no information regarding health facilities,
community centres, security and others. For planning reasons,
and in order to have a sustainable city, it is essential to consider
the mentioned services in the new land use plan of the neighbourhood. Generally, these services demands a good accessibility
to the road network and their location should be well studied.
Normally, it is recommended to locate them within 500 metres in
order to reach them easily within few minutes’ walk.
Fig.104: Canaan III: Existing public facilities
89
UrDI - Urban Structure Plan
F. NATURAL RESOURCES AND ENVIRONMENT
Due to the topography that is almost flat, there is barely no-built
areas in Canaan III. Two ravines that crosses the neighbourhood
in the North and therefore buffer zones are proposed to take
place. These open spaces of 50 metres from both sides of the
ravines are designed to mitigate the risk of flooding and to protect the environment. These spaces were also planned with the
potential to become public spaces. The no-built areas in Canaan
III form 0.72% of the total neighbourhood area.
#
16
17
m2
ha
%
Neighbourhood area
3.269.000
327
100%
Buffer zone next to ravines
13.968
1,39
Buffer zone next to ravines
9.636
0,96
Total:
23.604
2
No-built areas
#16
#17
0,72%
Table 15. Canaan III: Total percentage of no-built areas
Legend
Proposed buffer zone along the rivers and ravines
Proposed area for livestock grazing
Proposed area for reforestation
0
500
1000m
Produced 03.11.2016
High environmental risk areas
Existing rivers and ravines
Quarries
90
Fig.105: Canaan III: No-built areas
U r b a n D e v e l o p m e n t I n i t i a t i v e ( U r D I ) f o r C a n a a n a r e a o f Po r t - A u - P r i n c e
G. CANAAN III LAND USE
The land use plan of Canaan III is a result of a continuous engagement with the community. The plans were examined and
validated with the residents and the community leaders. The
assemblies, facilitated by the UN-Habitat team in Haiti, identified the main needs of the residents of Canaan III. It responds as
much as possible to their needs and proposes new ideas that can
induce prosperity and sustainability.
The plan was reviewed as a whole, taking into account the neighbourhoods nearby and how they connect. It is mandatory to situate each of the individual neighbourhood plans in the whole
Canaan area to achieve a coherent and rich structure.
Fig.106: Canaan III: Proposed land use plan
91
Comment citer
UN-Habitat; UCLBP, 2016, UrDI zone de Canaan : plan de quartier pour Canaan III, https://unhabitat.org/sites/default/files/2020/09/85._neighborhood_plans_en_canaan_iii.pdf