Teks Konple Dokiman an
Teks ki soti nan dokiman orijinal la pou endeksasyon.
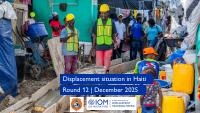
Displacement situation in Haiti
Round 12 | December 2025
TheopinionsexpressedinthispublicationarethoseoftheauthorsanddonotnecessarilyreflecttheviewsoftheInternationalOrganizationforMigration(IOM).Thedesignationsemployed
andthepresentationofmaterialthroughoutthepublicationdonotimplyexpressionofanyopinionwhatsoeveronthepartofIOMconcerningthelegalstatusofanycountry,territory,cityor
area,orofitsauthorities,orconcerningitsfrontiersorboundaries.
IOMiscommittedtotheprinciplethathumaneandorderlymigrationbenefitsmigrantsandsociety.Asanintergovernmentalorganization,IOMactswithitspartnersintheinternational
communityto:assistinmeetingtheoperationalchallengesofmigration;advanceunderstandingofmigrationissues;encouragesocialandeconomicdevelopmentthroughmigration;anduphold
thehumandignityandwell-beingofmigrants.
Mapsinthisreportareforillustrationpurposesonly.NamesandboundariesonthesemapsdonotimplyofficialendorsementoracceptancebyIOM.
Duetorounding,sometotalsforsingle-choicequestionsmaynotaddupexactlyto100percent.
ThispublicationwasmadepossiblethankstothefinancialsupportoftheInter-AmericanDevelopmentBank(IDB),throughthenationalEconomicandSocialAssistanceFund(FAES),aswellas
theUSDepartmentofState.Theopinionsexpressedhereinarethoseoftheauthorsanddonotnecessarilyreflectthoseoftheseinstitutions.
Publisher:InternationalOrganizationforMigration
RueE.Pierre,11(ZoneAmbassadedesÉtats-Unis)
Tabarre27
Port-au-Prince,Haïti
Email:dtmhaiti@iom.int
Website:https://dtm.iom.int/haiti
ThispublicationwasissuedwithoutformaleditingbyIOM.ThispublicationwasissuedwithoutIOMPublicationsUnit(PUB)approvalforadherencetoIOM’sbrandandstylestandards.This
publicationwasissuedwithoutIOMResearchUnit(RES)endorsement
Coverphoto:Sanitationworkinaspontaneoussiteinthecapital©IOMHaiti,August2025
Requiredcitation:InternationalOrganizationforMigration(IOM),February2026,DisplacementsituationinHaitiinDecember2025–Round12.IOMHaiti.
These activities were
implemented with
the support of:
2
Data collection was carried out
with the participation of the
following state institutions:
TABLE OF CONTENTS
SUMMARY
DISAGGREGATIONBYAGEANDSEX
HOSTINGLOCATIONSFORINTERNALLYDISPLACEDPERSONS
DISPLACEMENT TRENDS
ORIGINSOFINTERNALLYDISPLACEDPERSONS
FOCUS ON THE METROPOLITAN AREA OF PORT-AU-PRINCE
FOCUS ON MUNICIPALITIES OF THE WEST (OUT OF THE METROPOLITAN AREA OF PORT-AU-PRINCE)
FOCUS ON THE FOUR DEPARTMENTS OF THE GREAT SOUTH
FOCUS ON THE CENTRE DEPARTMENT
FOCUS ON THE ARTIBONITE DEPARTMENT
FOCUS ON THE THREE DEPARTMENTS OF THE GREAT NORTH
RETURNEES(FORMERLYINTERNALLYDISPLACEDPERSONS)
ANNEX 1. METHODOLOGY
ANNEX 2. ACCESSTOOTHERKEYINFORMATIONPRODUCTS
3
4
6
7
8
10
11
13
14
15
16
17
18
19
20
4
SUMMARY
1,450,254
internally displaced persons (IDPs)
(12% of the Haitian population)
333,729
displaced
households
increaseinthenumberofIDPscomparedtoRound11(September
2025).
Betweentheendof2024andtheendof2025,thetotalnumberof
IDPsnationwideincreasedby39percent.Themostsignificant
increasesduring2025wererecordedinCentre(+140%),
GreatNorth(+98%),andArtibonite(+77%).Theseincreases
followthedeteriorationofthesecuritysituationthatoccurredin
theCentreandArtibonitedepartmentsin2025.
+3%
54%
of IDPs are females
(adults et minors)
52%
of IDPs are children
85%
of IDPs are in host
families/out of sites
15%
are in sites
229
spontaneous sites
95sites in the capital, hosting 197,440 IDPs
134sites in provinces, hosting 20,004 IDPs
20%of IDPs are hosted in the capital
80%of IDPs are hosted in provinces.
1
Artibonite experienced the largest increase in the number of
IDPs, rising from 121,896 in Round 11 to 150,279 in Round 12, representing
a 23 per cent increase.
44%of IDPs are hosted in only 10municipalities :
Port-au-Prince (in the department of West, with 11% of IDPs in the country),
Delmas (West, 5%), Jacmel (South-East; 5%), Verrettes (Artibonite; 5%,
Belladère(Centre; 4%), Cap Haïtien(North, 4%), Les Cayes (South, 3%),
Léogâne (West, 3%), Hinche (Centre, 2%), et Aquin (South, 2%)
1.The term "provinces" refers to all areas of the country outside the Metropolitan Area of Port-au-Prince (MAPAP), the capital. The MAPAP consists of the municipalities of Port-au-Prince, Delmas, Cité Soleil, Pétion-Ville, Carrefour, Tabarre, and Croix-des-Bouquets.
99%of IDPs were displaced due to armed violence or generalisedinsecurity, and
1% due to disasters.
4
Host regions
# of displaced
households
# of IDPs % of IDPs
West (28%)
MAPAP 76,775 291,717 20%
Outside MAPAP 23,515 116,221 8%
Great South
(39%)
South 46,214 197,505 14%
South-East 36,565 166,115 11%
Grande'Anse 28,201 128,792 9%
Nippes 17,834 70,637 5%
Centre (11%)Centre 36,476 162,374 11%
Artibonite
(10%)
Artibonite 32,274 150,279 10%
Great North
(11%)
North 28,591 134,991 9%
North-West 4,651 20,233 1%
North-East 2,633 11,390 1%
TOTAL 333,729 1,450,254 100%
* Percentages do not equal 100 due to rounding.
This map is for illustration purposes only. Names and boundaries on this map do not imply official endorsement or acceptance by IOM.
Table 1. NumberandproportionofIDPsbyhostarea*
Map 1. NumberofIDPsbydepartment
Table 2. IDPsoutsidesites/withhostfamiliesvs.insites,byhostarea
Host regions # of IDPs
% of IDPs out of
sites
% of IDPs in
sites
# of sites
West
MAPAP 291,717 32% 68% 95
Outside
MAPAP
116,221 98% 2% 18
Great
South
South 197,505 100% 0% 0
South-East 166,115 100% 0% 0
Grande'Anse128,792 100% 0% 0
Nippes 70,637 100% 0% 0
Centre Centre 162,374 96% 4% 67
ArtiboniteArtibonite150,279 94% 6% 44
Great
North
North 134,991 99.7% 0.3% 4
North-West 20,233 100% 0% 0
North-East 11,390 98% 2% 1
TOTAL 1,450,254 85% 15% 229
5
4%
6%
9%
11%
20%
4%
3%
5%
8%
10%
16%
4%
<1
1 - 5
6 - 11
12 - 17
18 - 59
60+
DISAGGREGATION BY AGE AND SEX OF
INTERNALLY DISPLACED PERSONS
6
3%
6%
8%
11%
22%
5%
3%
5%
7%
9%
18%
4%
<1
1 - 5
6 - 11
12 - 17
18 - 59
60+
Graph1.DisaggregationbyageandsexofIDPs*
Graph2.DisaggregationbyageandsexofIDPshostedinsites*
Graph3.DisaggregationbyageandsexofIDPshostedoutofsites
Female
(54%)
Male
(46%)
1%
3%
5%
8%
30%
5%
1%
3%
5%
7%
27%
4%
<1
1 - 5
6 - 11
12 - 17
18 - 59
60+
Female
(53%)
Male
(47%)
Female
(54%)
Male
(46%)
Morethanhalfofinternallydisplacedpersons(IDPs)(54%)arefemales(adultsandminors),and
52percentarechildren.ThedemographiccompositionofIDPslivinginsitesdiffersfromthatof
IDPsresidingoutside,asobservedinpreviousassessments.Insites,themajorityofdisplaced
personsareadults(66%,comparedto34%children).Conversely,outsidesites,children
constitutethemajority(56%,comparedto44%adults).Thisdifferencecanbeexplainedin
particularbytheseverityoflivingconditionsinsites,whichforcesmanydisplacedpersonsto
separatefromtheirchildrenbyentrustingthemtorelatives,oftensendingthemfromthecapital
toprovinces.
* Percentages do not equal 100 due to rounding.
HOST LOCATIONS FOR INTERNALLY DISPLACED PERSONS
11
Municipality Department # of IDPs % of IDPs in the country
Port-au-Prince West 162,606 11%
Delmas West 74,591 5%
Jacmel South-East 68,182 5%
Verrettes Artibonite 67,707 5%
Belladère Centre 61,208 4%
Cap-Haïtien North 61,096 4%
Les Cayes South 47,934 3%
Léogâne West 44,533 3%
Hinche Centre 29,738 2%
Aquin South 28,424 2%
Map 2. IDPsbydepartmentandpresenceofspontaneoussites Map 3. IDPsbymunicipalityandpresenceofspontaneoussites
Table 3. Top10hostmunicipalitiesforIDPs
Nearlyhalf(44%)ofinternallydisplacedpersons(IDPs)areconcentratedinonly10communes,illustratinga
highdensityofdisplacedpopulationsinthesespecificareas.
Furthermore,asduringRound11,themajorityofIDPsarehostedinprovinces(80%,comparedto20%inthe
MetropolitanAreaofPort-au-Prince-MAPAP).Inprovinces,almostalldisplacedpersons(98%)liveoutside
sites—withhostfamiliesorinrentedaccommodation—whileinthecapital,themajorityliveinspontaneous
sites(68%).
Outofthe229spontaneoussitesnationwide,95(41%)arelocatedinthecapitaland134(59%)inprovinces.
However,thetotalnumberofIDPsinsitesremainshigherinthecapitalduetothegreaterpopulationdensity
ofitssites.Thus,the95sitesinthecapitalhost197,440people,comparedto20,004peoplespreadacross
the134sitesinprovinces.Onaverage,asiteinthecapitalhosts2,078IDPscomparedtoonly149persitein
provinces.
7
These maps are for illustration purposes only. Names and boundaries on these maps do not imply official endorsement or acceptance by IOM.
DISPLACEMENT TRENDS
Host regions # of IDPs in Round 11 # of IDPs in Round 12 % of variation # of sites in Round 11 # of sites in Round 12
West
MAPAP 293,410 291,717 -1% 97 95
Outside MAPAP 100,020 116,221 +16% 15 18
Great South
South 200,907 197,505 -2% 2 0
South-East 161,291 166,115 +3% 0 0
Grande'Anse 126,386 128,792 +2% 0 0
Nippes 64,439 70,637 +10% 0 0
Centre Centre 199,258 162,374 -19% 87 67
Artibonite Artibonite 121,896 150,279 +23% 29 44
Great North
North 118,840 134,991 +14% 7 4
North-West 19,112 20,233 +6% 0 0
North-East 6,640 11,390 +72% 1 1
TOTAL 1,412,199 1,450,254 +3% 238 229
Table 4. ChangeinthenumberofIDPsbetweenRounds11and12,byhostarea
BetweenRound11(September2025)andRound12(December2025),thetotalnumberofIDPsslightlyincreased(3%).However,thisnationaltrendmaskssignificantregionalvariations.The
Artibonitedepartmentrecordedthemostsignificantincrease,withariseof23percent(from121,896to150,279people),mainlyduetoaseriesofarmedattacksthatoccurredbetweenOctober
andDecember2025.
2
OthernotableincreaseswereobservedinNorth-East(+72%)andNorth(+14%),whichcanbeexplainedbysignificantmovementsofIDPsleavingtheCentredepartmentto
seekrefugefurthernorthofthecountry.Thismovementtowardsthenorthalsoledtoa19percentdecreaseinthenumberofdisplacedpersonsintheCentredepartment.
Analysisoftrendsoverrecentyears(seeGraph4onthenextpage)reinforcestheunderstandingtheevolutionofthedisplacementsituationinthecountry.Betweentheendof2022andtheendof
2025,thenumberofIDPsincreasedby835percent.Thesharpestrisewasobservedin2024,witha232percentincreasecomparedtotheendof2023.In2025,theincreasewassmaller(+39
percentcomparedto2024).Thissmallerincreasein2025canbeexplainedbyageographicalshiftinarmedviolence:whilein2024violencewasconcentratedindenselypopulatedurbanareasof
thecapital,generatingmassivedisplacement,2025wasmarkedbyanupsurgeinviolenceinprovinces,preciselyinArtiboniteandCentre.Thesepredominantlyruraldepartments,lesspopulatedthan
thecapital,produceddisplacementsonasmallerscale.In2024,76percentofmassivedisplacementstriggeredbyspecificarmedattacksoccurredinthecapital,comparedto24percentin
provinces.In2025,thetrendreversedwithonly27percentofmassivedisplacementsoccurringinthecapital,comparedto73percentinprovinces(including38%inArtiboniteand31%in
Centre).
3
2.For more information, please refer to the following Emergency Tracking reports #73, #74, #75, #76, #79, #80, #81 and #82
3.For more information, please consult the Emergency Tracking dataset (only available in French)
8
Graph 4. Evolutionofthedisplacementsituationbetween2022and2025
9
113,582
155,166
127,977
194,624
313,901
362,551
578,074
702,973
1,041,229
1,287,593
1,412,199
1,450,254
Round 1 (September
2022)
Round 2 (November
2022)
Round 3 (March 2023)Round 4 (June 2023)Round 5 (December
2023)
Round 6 (March 2024)Round 7 (June 2024)Round 8 (September
2024)
Round 9 (December
2024)
Round 10 (June 2025)Round 11 (September
2025)
Round 12 (December
2025)
2022 2023 2024 2025
102%increaseinthenumberofIDPsduring
theyear2023(comparisonofthesituation
betweentheendof2022andtheendof2023)
232%increaseinthenumberofIDPsduringtheyear2024
(comparisonofthesituationbetweentheendof2023andthe
endof2024)
835%increaseinthenumberofIDPsinnearlythreeyears(comparisonofthesituationbetweentheendof2022andtheendof2025)
39%increaseinthenumberofIDPsin2025
9
25%
17%
10%
7%
5%
2%2%4%
13%
2%<1%
4%3%3%2%1%
Port-au-Prince
Gressier
Carrefour
Delmas
Croix-Des-Bouquets
Kenscoff Arcahaie
Other
Mirebalais Saut d'Eau
Other
Petite Rivière de
l'Artibonite
Saint-Marc
Verrettes
L'Estère
Other
West (72%) Centre (15%) Artibonite (13%)
ORIGINS OF INTERNALLY DISPLACED PERSONS
Nearlythree-quartersofIDPs(72%)fledlocalitiesintheWestdepartment,andespeciallythecapital,
theMAPAP,whichaloneaccountsfor49percentofIDPs'placesoforigin.
ArmedviolenceintheCentreandArtibonitedepartmentsalsomakesthesedepartmentssignificant
areasoforiginfordisplacedpersons.Differentiateddisplacementpatternsarealsoobserved
accordingtoorigin:peoplefleeingtheWest,particularlytheMAPAP,mainlymovedtootherareasof
theWest(notablywithinthecapital)ortotheGreatSouthdepartments.Conversely,thosedisplaced
fromCentreandArtiboniteremainedinthesesamedepartmentsormovedtowardsthenorthof
thecountry.
Map 4. MunicipalitiesoforiginofIDPs
Graph 5. MunicipalitiesoforiginofIDPs
Graph 6. Departmentsoforigin(left)andhostdepartments(right)ofIDPs
10
This map is for illustration purposes only. Names and boundaries on this map do not imply official endorsement or acceptance by IOM.
FOCUS ON THE METROPOLITAN AREA OF PORT -AU-PRINCE
291,717
internally displacedpersons
76,775
displacedhouseholds
decrease in the number of IDPs,
compared to Round 11-<1%
32%
of IDPs are in host
families/out of sites
68%
in sites
95
spontaneous sites
(-2 sites compared to
Round 11)
Municipality
# of
displaced
households
# of IDPs
% of IDPs in
the MAPAP
Port-au-Prince41,534162,606 56%
Delmas 21,79774,591 26%
Pétion-Ville 5,02022,648 8%
Cité Soleil3,89414,366 5%
Carrefour 2,4069,855 3%
Tabarre 1,3314,369 1%
Croix-Des-
Bouquets
7933,282 1%
TOTAL 76,775291,717 100%
Neighborhood Municipality# of IDPs
% of IDPs in
the MAPAP
Bois VernaPort-au-Prince29,751 10%
Bourdon Port-au-Prince12,971 4%
Delmas 2 -Saint-
Martin -Tokyo
Port-au-Prince12,550 4%
Christ-Roi -LaluePort-au-Prince11,481 4%
Cite Plus Port-au-Prince10,410 4%
Bolosse Port-au-Prince8,220 3%
Kernizan -Defilee-
Charlemagne Peralte
Delmas 7,758 3%
Bas MartissantPort-au-Prince6,939 2%
Cite LouverturePort-au-Prince6,844 2%
Avenue ChristophePort-au-Prince6,043 2%
Map5.DisplacementsituationintheneighborhoodsoftheMAPAP Table5.IDPsbyhostmunicipalityintheMAPAP Table6.Top10hostneighborhoodsforIDPsintheMAPAP
Graph7.EvolutionofthenumberofIDPsintheMAPAPfrom2022to2025
ThenumberofIDPsintheMAPAPremainedrelativelystable,duetoarelativedecreaseinarmedattacksinthecapital.IntheMAPAP,68percentofIDPsliveinspontaneoussites(197,440
people),makingthisareatheonlyoneinthecountrywherethistypeofaccommodationremainspredominant.MorethanhalfoftheIDPsinthecapital(56%)areconcentratedinthemunicipality
ofPort-au-Prince,primarilyinspontaneoussites;ofthe95sitesidentifiedintheMAPAP,55arelocatedinthissinglemunicipality.Delmasrankssecond,with26percentofIDPs.Itisalso
noteworthythatnearly40percentofdisplacedpersonsintheMAPAParelocatedinjust10neighborhoods(outofthe429inthearea),highlightingasignificantconcentrationofdisplaced
populationsinthefewsectorsofthecapitalthatstillprovidearelativesenseofsecurity.AlmostallIDPsintheMAPAP(96%)hadfledfromotherneighborhoodswithinthesamezone,and4per
centcamefromthemunicipalityofKenscoff.
11
87,985
155,166
127,977
130,884139,853
160,550
184,789
173,156
261,448
296,936 293,410
291,717
R1 (Aug
2022)
R2 (Nov
2025)
R3 (March
2023)
R4 (Jun
2023)
R5 (Nov
2023)
R6 (March
2024)
R7 (Jun
2024)
R8 (Sept
2024)
R9 (Dec
2024)
R10 (Jun
2025)
R11 (Sept
2025)
R12 (Dec
2025)
This map is for illustration purposes only. Names and boundaries on this map do not imply official endorsement or acceptance by IOM.
Municipality# of IDPs
% of IDPs out of
sites
% of
IDPs in
sites
# of sites
Port-au-Prince 162,606 8% 92% 55
Delmas 74,591 61% 39% 17
Pétion-Ville 22,648 72% 28% 5
Cité Soleil 14,366 34% 66% 10
Carrefour 9,855 83% 17% 4
Tabarre 4,369 94% 6% 3
Croix-Des-
Bouquets
3,282 84% 16% 1
TOTAL 291,717 32% 68% 95
Type of sites # of sites
# of IDPs in
sites
% of IDPs in
sites
School 32 76,579 39%
Uncovered and fenced area 19 40,177 20%
Covered and fenced area 16 37,017 19%
Church / Temple 21 34,967 18%
Uncovered and unfenced area 5 6,816 3%
Covered and unfenced area 2 1,884 1%
TOTAL 95 197,440 100%
Map 6. Types of sites in the MAPAP Table 7. IDPsoutsidesites/withhostfamiliesvs.insites,byhostmunicipalityintheMAPAP
Table 8. IDPs by type of sites in the MAPAP
IntheMAPAP,asitehostsanaverageof2,078IDPscomparedto1,992duringRound11,aslightincreaseintheaveragedensitypersite.ThedistributionofIDPsbetweensitesand
outsidesitesremainsstablecomparedtothepreviousround,with68percentlivinginsitescomparedto32percentoutside(comparedto66%and34%duringRounds11and10).
AmongIDPshostedinsitesinthecapital,39percentarelocatedinschools,withnearly77,000peopleacross32establishments.Althoughthenumberofschoolsusedashosting
sitesremainedunchanged,thenumberofIDPsresidingthereincreasedby6percent,from71,970to76,579people.Toreducetheimpactonschooling,theEducation,Shelter,and
CCCMclustershavedevelopedguidelinesthataimtoreconcilethehostingandprotectionofIDPsinschoolswiththecontinuationofeducationalactivities
4
.
12
This map is for illustration purposes only. Names and boundaries on this map do not imply official endorsement or acceptance by IOM.
4.For more information, please consult these guidelines (only available in French)
10,127 6,168
30,929
24,697
68,411
144,152
115,935
100,020
116,221
R4 (Jun 2023)R5 (Nov 2023)R6 (March
2024)
R7 (Jun 2024)R8 (Sept 2024)R9 (Dec 2024)R10 (Jun 2025)R11 (Sept 2025)R12 (Dec 2025)
FOCUS ON MUNICIPALITIES OF THE WEST (OUT OF
THE METROPOLITAN AREA OF PORT -AU-PRINCE)
116,221
internallydisplaced persons
23,515
displacedhouseholds
increasein the number of IDPs,
compared to Round 11+16%
96%
of IDPs are in host
families/out of sites
4%
in sites
18
spontaneous sites
(+3 sites compared to
Round 11)
Map7.DisplacementsituationinthemunicipalitiesoftheWestoutsidetheMAPAP
Table9.IDPsbyhostmunicipalityinthemunicipalitiesoftheWestoutsidetheMAPAP
Graph9.EvolutionofthenumberofIDPsinthemunicipalitiesofWestoutsidetheMAPAPbetweenJune2023andtheendof2025
5
Municipality
# of
Displaced
households
# of IDPs% of IDPs
# of
sites
Léogâne 9,55544,53338% 5
Arcahaie 3,17016,64614% 5
Grand-Goâve 2,57415,38713% 0
Cabaret 2,87314,38112% 2
Petit-Goâve 2,18310,874 9% 0
Pointe à Raquette 876 5,272 5% 0
Anse à Galets 1,0404,433 4% 0
Kenscoff 768 2,825 2% 6
Cornillon/ Grand Bois476 1,870 2% 0
Total 23,515116,221100% 18
Graph8.MunicipalitiesoforiginofIDPslivingin
areasofWestoutsidetheMAPAP
5.BeforeRound4,theseDTMassessmentswerelimitedtotheMAPAP.However,atthebeginningof2023,DTMbegantoobservemassivepopulationdisplacementsfromthecapitaltoprovinces,whichledtoaprogressiveexpansionofthegeographicalcoverageoftheassessments.Starting
fromRound4(June2023),theywereextendedtotheentireWestdepartment,aswellastoCentreandArtibonite.InNovember2023(Round5),coveragewasextendedtothefourdepartmentsoftheGreatSouth.Finally,asofJune2024(Round7),theassessmentscovertheentire
nationalterritory,includingtheNorth,North-East,andNorth-Westdepartments.
6.For more information, please refer to the following Emergency Tracking reports #76 and #77
InthemunicipalitiesoftheWestdepartmentlocatedoutsidetheMAPAP,thenumberofIDPsincreasedby16percentbetweenRounds11and12,risingfrom100,020to116,221.Thisincreaseis
mainlyexplainedbyarmedattacksthatoccurredinlate2025inthesurroundingareas.
6
LéogâneistheprimaryhostmunicipalityforIDPsinthispartoftheWest,concentrating38percentof
displacedpersons.ThevastmajorityofIDPs(96%)liveoutsidesites,while4percentresidein18sitesdistributedacrossLéogâne,Arcahaie,Cabaret,andKenscoff.Furthermore,93percentofIDPs
hostedinthemunicipalitiesofWestoutsidetheMAPAPcomefromlocalitieswithinthesamedepartment.ThemunicipalityofGressierremainsthemainplaceoforigin,withapproximately6outof
10displacedpersonshavingfledthisarea.GressierisalsothesecondmostcommonmunicipalityoforiginforIDPsnationwide(seePage10).
13
58%
23%
8%
2%
2%
6%
1%
Gressier
Arcahaie
Cabaret
Kenscoff
Léogâne
Mirebalais
West (93%)
Centr e (6%)
Other
(1%)
This map is for illustration purposes only. Names and boundaries on this map do not imply official endorsement or acceptance by IOM.
33%
27%
23%
7%
6%
3%
1%
<1%
<1%
Gressier
Port-au-Prince
Carrefour
Delmas
Croix-Des-Bouquets
Kenscoff
Cité Soleil
Tabarre
Léogâne
West (100%)
FOCUS ON THE FOUR DEPARTMENTS OF THE GREAT SOUTH
563,049
internallydisplacedpersons
128,814
displacedhouseholds
increasein the number of IDPs,
compared to Round 11+2%
100%
of IDPs are in host
families/out of sites
0
spontaneous site
(-2 sites compared
to Round 11)
MunicipalityDepartment
Displaced
households
# of IDPs
% of IDPs
in the
Great
South
Jacmel South-East 15,95968,18212%
Les Cayes South 12,86547,934 9%
Aquin South 5,55028,424 5%
JérémieGrande'Anse 5,35725,478 5%
Cavaillon Sud 4,37821,896 4%
La ValléeSouth-East 3,78319,276 3%
AbricotsGrande'Anse 4,45018,750 3%
Torbeck South 4,88717,851 3%
PestelGrande'Anse 3,51416,165 3%
Bainet South-East 3,69915,114 3%
Saint Louis du
Sud
South 3,19514,998 3%
Côtes de FerSouth-East 2,83514,125 3%
Map8.DisplacementsituationintheGreatSouth Table10.Top12hostmunicipalitiesforIDPsintheGreatSouth
Graph10.MunicipalitiesoforiginofIDPshostedintheGreatSouth
Graph11.EvolutionofthenumberofIDPsintheGreat
Southbetweentheendof2023andtheendof2025
IntheGreatSouth,thenumberofIDPschangedlittlebetweenRounds11and12,recordinga2percentincrease.All
IDPsinthisarearesideoutsidesites,asthetwositesthatwereopenduringRound11havesinceclosed.
MorethanhalfofthedisplacedpersonsintheGreatSouth(56%)areconcentratedin12municipalitiesoutofthe51
intheregion,indicatingaconcentrationofIDPsinspecificareas,particularlyurbanones.ThemunicipalitiesofJacmel
andLesCayesalonehost21percentoftheIDPsintheGreatSouth.
AlldisplacedpersonsinthisregionfledtheWestdepartment,with83percentofthemcomingfromthree
communes:Gressier(33%),Port-au-Prince(27%),andCarrefour(23%).
14
116,422
116,422
268,452
315,200
398,016
497,768
553,023
563,049
R5
(Nov
2023)
R6
(March
2024)
R7 (Jun
2024)
R8
(Sept
2024)
R9
(Dec
2024)
R10
(Jun
2025)
R11
(Sept
2025)
R12
(Dec
2025)
This map is for illustration purposes only. Names and boundaries on this map do not imply official endorsement or acceptance by IOM.
28,975 22,935 22,935
40,753
52,045
67,608
147,230
199,258
162,374
R4 (Jun 2023)R5 (Nov 2023)R6 (March 2024)R7 (Jun 2024)R8 (Sept 2024)R9 (Dec 2024)R10 (Jun 2025)R11 (Sept 2025)R12 (Dec 2025)
FOCUS ON THE CENTREDEPARTMENT
162,374
internallydisplacedpersons
36,476
displaced households
decreasein the number of IDPs,
compared to Round 11-19%
96%
of IDPs are in host
families/out of sites
4%
in sites
67
spontaneous sites
(-20 sites compared
to Round 11)
Map9.DisplacementsituationinCentre
Table11.IDPsbyhostmunicipalityinCentre
Graph13.EvolutionofthenumberofIDPsinCentrebetweenJune2023andDecember2025
Municipality
Displaced
households
# of IDPs
% of IDPs
in Centre
# of
sites
Belladère 14,78661,20838% 14
Hinche 6,35829,73818% 18
Boucan Carré 5,40124,15515% 14
Thomassique 1,7728,842 5% 1
Lascahobas 1,7638,819 5% 7
CercaCarvajal 1,7538,757 5% 1
Thomonde 1,5006,101 4% 6
Savanette 970 5,008 3% 5
Maïssade 1,0734,492 3% 1
Mirebalais 650 3,250 2% 0
Sautd'Eau 260 1,312 1% 0
CercaLa Source 190 692 <1% 0
Total 36,476162,374100% 67
Graph12.MunicipalitiesoforiginofIDPshostedinCentre
IntheCentredepartment,thenumberofIDPsdecreasedby19percentbetweenRounds11and12,from199,258to162,374.Thedepartmenthas20sitesless(87to67activesitesfromRound
11to12),withsomedisplacedpersonsdecidingtorelocatewithrelativesinthenorthofthecountry(seePages8and17).Despitethisdecrease,Centreremainstheareawiththesecond-highest
numberofspontaneoussitesaftertheMAPAP,althoughthesesiteshostrelativelyfewdisplacedpersons.Overall,94percentofdisplacedpersonsinCentreliveoutsidesites,while4percent(or
6,848people)resideinthe67identifiedsites,withanaverageof102peoplepersite(anaverage20timeslowerthanthatobservedintheMAPAP;seePage12).Nearlythree-quartersofIDPsin
Centre(71%)areconcentratedinthreemunicipalities(outofthe12)inthedepartment:Belladère(38%),Hinche(18%),andBoucanCarré(15%),indicatingahighdensityofdisplacedpersonsin
certainspecificareas.
Despitethe19percentdecreaseinthenumberofIDPsbetweenRounds11and12,thecomparisonbetweentheendof2024andtheendof2025showsasignificantincreaseinthenumberof
IDPsintheCentre.Betweentheendof2024(Round9)andtheendof2025(Round12),thenumberofIDPsinCentreincreasedfrom67,608to162,374,anincreaseof140percentinoneyear.
ThiswasthelargestincreaseinthenumberofIDPsrecordedinanyregionin2025.Thisincreasereflectsadeteriorationinthedepartment’ssecuritysituationin2025,particularlyfollowingarmed
attacksbetweenAprilandJulyinthemunicipalitiesofMirebalaisandSaut-d'Eau.
88%
12%
Mirebalais
Saut d'Eau
Centre (100%)
15
30%
29%
17%
8%
2%
2%
2%
5%
2%
2%
1%
Petite Rivière de l'Artibonite
Verrettes
L'Estère
Saint-Marc
Dessalines
La Chapelle
Other
Port-au-Prince
Kenscoff
Arcahaie
Other
Artibonite (90%)
West (10%)
FOCUS ON THE ARTIBONITE DEPARTMENT
150,279
internally displaced persons
32,274
displaced households
increase in the number of IDPs,
compared to Round 11+23%
94%
of IDPs are in host
families/out of sites
6%
in sites
44
spontaneous sites
(+15 sites compared
to Round 11)
Map10.DisplacementsituationinArtibonite
Graph15.EvolutionofthenumberofIDPsinArtibonite
betweenJune2023andDecember2025
Municipality
Displaced
households
# of IDPs
% of IDPs in
Artibonite
# of
sites
Verrettes 14,95567,707 45% 16
Saint-Marc 3,72418,120 12% 13
Gonaïves 2,74413,820 9% 0
Saint-Michel de
l'Attalaye
2,40112,497 8% 1
Gros Morne 1,812 8,800 6% 0
Dessalines 2,135 8,594 6% 1
Anse Rouge 983 4,912 3% 0
Ennery 880 4,333 3% 1
Petite Rivière de
l'Artibonite
539 2,179 1% 6
La Chapelle 418 2,108 1% 1
L'Estère 326 1,933 1% 3
Terre Neuve 513 1,748 1% 0
Marmelade 244 1,310 1% 0
Grande Saline 283 1,138 1% 0
Desdunes 317 1,080 1% 2
Total 32,274150,279 100% 44
Graph14.MunicipalitiesoforiginofIDPshostedinArtibonite
TheArtibonitedepartmentrecordedanincreaseof28,393IDPsbetweenRounds11and12(+23%comparedtoRound11).Thiswas
thelargestincreaseobservednationwidebetweenthesetworounds.Thistrendisexplainedbythefactthatthisdepartmentwas,in
late2025,themainareaaffectedbyarmedattacksthatresultedinmassivedisplacement.
7
ComparedtoDecember2024(Round9),
thenumberofIDPsinArtiboniteincreasedby77percent(84,719to150,279individuals),makingitthedepartmentwiththelargest
increasein2025aftertheCentredepartment.ThemunicipalitiesofPetiteRivièreandVerrettesaretheplacesoforiginfornearly60
percentofIDPsinthedepartment.ItshouldbenotedthatthemunicipalityofVerretteshostsnearlyhalfoftheIDPsinArtibonite
(45%).
* Percentages do not equal 100 due to rounding.
7.For more information, please refer to the following Emergency Tracking reports #73, #74, #75, #76, #79, #80, #81 et #82 16
22,440
27,43027,430
34,952
44,566
84,719
92,304
121,896
150,279
R4 (Jun
2023)
R5 (Nov
2023)
R6 (March
2024)
R7 (Jun
2024)
R8 (Sept
2024)
R9 (Dec
2024)
R10 (Jun
2025)
R11 (Sept
2025)
R12 (Dec
2025)
This map is for illustration purposes only. Names and boundaries on this map do not imply official endorsement or acceptance by IOM.
Table12.IDPsbymunicipalityinArtibonite*
FOCUS ON THE THREEDEPARTMENTS OF THE GREAT NORTH
166,614
internallydisplacedpersons
35,875
displacedhouseholds
increasein the number of IDPs,
compared to Round 11+15%
99.6%
of IDPs are in host
families/out of sites
0.4%
in sites
5
spontaneous sites
(-3 sites compared
to Round 11)
Map11.DisplacementsituationintheGreatNorth
Graph17.EvolutionofthenumberofIDPsintheGreat
NorthbetweenJune2024andDecember2025
Graph16.MunicipalitiesoforiginofIDPshostedintheGreatNorth
IntheGreatNorth,thenumberofIDPsincreasedby15percentbetweenRounds11and12,risingfrom144,592to166,614.Thisincrease
ismainlyexplainedbythedisplacementofIDPswhowerepreviouslyinCentre,particularlyinsites,andwholefttheirinitialhostlocationsto
gotorelativesfurthernorthinthecountry.Infact,thedeteriorationofthesecuritysituationinCentreandArtibonitein2025ledtoa
significantincreaseinthenumberofIDPsinthethreedepartmentsoftheGreatNorth(+98%;from84,047inDecember2024to166,614in
December2025).AlmostallIDPsinthisregion(99.6%)liveoutsidesites.Itisalsoworthnotingthat,overall,theGreatNorthischaracterised
bythegreatestdiversityofIDPs’originsnationwide:38percentofthemfledtheWestdepartment,mainlythemunicipalityofPort-au-Prince;
35percentareoriginallyfromArtibonite,especiallythemunicipalityofSaint-Marc;and27percentcomefromCentre,particularlythe
municipalityofMirebalais.Furthermore,Cap-HaïtienisthemainhostmunicipalityintheGreatNorth,concentrating37percentofthe
region'sIDPs.
MunicipalityDepartment
Displaced
households
# of IDPs
% of IDPs
in the
Great
North
Cap-Haïtien North 13,54661,09637%
Plaisance North 1,95312,405 7%
Limbé North 1,8979,591 6%
Limonade North 1,7858,961 5%
Pilate North 1,3126,561 4%
Jean RabelNorth-West 1,2196,074 4%
Grande Riviere
Du Nord
North 1,1555,830 3%
Quartier MorinNorth 1,0905,200 3%
Borgne North 8604,615 3%
Acul du Nord North 1,4154,301 3%
Ouanaminthe North-East 8614,205 3%
Saint-Louis du
Nord
North-West 1,0774,014 2%
Table13.Top12hostmunicipalitiesforIDPsintheGreathNorth
17
16%
8%
6%
3%
2%
2%
1%
21%
11%
3%
25%
2%
Port-au-Prince
Croix-Des-Bouquets
Delmas
Carrefour
Kenscoff
Cité Soleil
Other
Saint-Marc
Petite Rivière de l'Artibonite
Other
Mirebalais
Other
West (38%)
Artibonite (35%)
Centre (27%)
22,841
93,053
84,047
137,075 144,592
166,614
R7 (Jun
2024)
R8 (Sept
2024)
R9 (Dec
2024)
R10 (Jun
2025)
R11 (Sept
2025)
R12 (Dec
2025)
This map is for illustration purposes only. Names and boundaries on this map do not imply official endorsement or acceptance by IOM.
RETURNEES (FORMERLY INTERNALLY DISPLACED PERSONS)
87,600
returnedindividuals
20,367
returnedhouseholds
-5%
decrease in the number
of returnees, compared
to Round 11 Areas of return
# of returned
households
# of returned
individuals
% of returned
individuals
Variation compared
to Round 11
West
MAPAP 8,984 36,061 41% +120%
Outside MAPAP 682 2,920 3% -92%
Centre 3,670 18,360 21% +157%
South 3,206 14,316 16% +23%
Artibonite 3,202 13,063 15% -39%
North-West 546 2,488 3% +100%
North 77 392 <1% 0%
TOTAL 20,367 87,600 100% -6%
MunicipalityDepartment
# of returned
households
# of returned
individuals
% of returned individuals in
the country
Port-au-Prince West 3,920 16,664 19%
Lascahobas Centre 2,960 14,800 17%
Tiburon South 2,266 9,782 11%
Dessalines Artibonite 2,250 8,900 10%
Delmas West 1,923 7,016 8%
Croix-Des-
Bouquets
West 1,492 5,823 7%
Cité Soleil West 1,077 4,500 5%
Les Anglais South 760 3,840 4%
Mirebalais Centre 550 2,750 3%
Bassin BleuNorth-West 495 2,285 3%
Thenumberofreturnees(formerlyIDPs)decreasedslightlybetweenRounds11and12(-5%),butsignificantregionaldisparitiesshouldbenoted.Whilethisnumberfellsharplyinthemunicipalities
ofWestoutsidetheMAPAP(-92%),particularlyinCabaret,aswellasintheArtibonitedepartment(-39%),otherareasrecordedincreases.ThiswasparticularlythecaseintheMAPAPandthe
Centredepartment,wherethenumberofreturneesincreasedby120and157percent,respectively.
IntheMAPAP,returnswereobservedincertainneighborhoodsofthePort-au-Princemunicipality,suchasTiSavanneTrantin,CroixDespresTi-Source,PacotandTapisRouge.InCentre,some
IDPschosetoleavespontaneoussitestoreturntothemunicipalitiesofMirebalaisandSauts-d'Eautoresumetheiragriculturalactivities,despitethepersistentsecurityrisks.However,itshouldbe
emphasisedthatitisstillprematuretoconsiderthesereturnsdurable.Theyremainfornowcircumstantialandfragile,giventhevolatilityofthesecuritysituation.DTMwillcontinuetomonitor
returntrendsandtheirdurability.
Map12.ReturnareasforreturneesformerlyIDPs
Table14.Returneesbyreturnarea
Table15.Top10ofmunicipalitiesofreturn
18
SinceAugust2022,theGeneralDirectionforCivilProtection(DGPC)andIOM'sDisplacement
TrackingMatrix(DTM)havebeenconductingperiodicassessmentsoflocationshostingdisplaced
populations.Theseassessmentsaimtoprovidekeyinformationonthedisplacementsituationand
thelivingconditionsandneedsofdisplacedpersons.Theobjectiveistoinformresponsestrategies,
whetherforhumanitarianinterventionsorprogramsaimedatdurablesolutions.
Dataiscollectedthroughdirectobservationsandgroupinterviewswithkeyinformants,atthemost
granulargeographicallevel,namely:theneighborhoodintheMAPAP,thecountry'scapital;the
communalsectionoutsidetheMAPAP;andthespontaneoussite,whereitexists.Onaverage,three
keyinformantswereinterviewedperassessedlocality.
DatacollectionforRound12wasconductedbetween5December2025and6January2026by
543enumerators(including62%menand38%women).Atotalof4,343keyinformants(69%men
and31%women)wereinterviewedinthe1,160assessedlocalities,distributedasfollows:517
communalsectionsoutsidetheMAPAP,408neighborhoodsintheMAPAPand229spontaneous
sites.Duetosecurityconstraints,keyinformantinterviewsin10percentoflocalitieswere
conductedremotely,whiletheremaining90percentwereassessedthroughfieldinterviews(see
Map13).DatacollectionwascarriedoutbyIOMandDGPCteams,withtheactiveparticipationof
stafffromtheNationalOfficeofMigration(ONM),theHaitianInstituteofStatisticsandComputer
Science(IHSI),andtheHousingandPublicBuildingConstructionUnit(UCLBP).).
Limits:
Theinformationcollectedisbasedonestimatesprovidedbykeyinformantsfortheirown
community.Inordertoobtainthemostreliableestimatespossible,i.e.,thoseclosesttoreality,
assessmentsareconductedatthelowestgeographicallevel,andthekeyinformantsinterviewedare
thosewiththebestknowledgeoftheirlocality(seeGraph18).
1,160
assessed localities
4,343
key informants interviewed
(90% assessed through field
interviews and 10% by phone)
Map13.LocalitiesassessedinthefieldduringRound12
Graph18.ProfilesofkeyinformantsinterviewedduringRound12
19
38%
17% 14% 14%
7% 4% 2% 2% 2%
Members of
community
associations
People holding a
key profession
in the
community
(Teacher,
Doctor, Nurse,
etc.)
Representatives
of displaced
persons
Members of
CASEC/ASEC
Civil protection
focal points
Religious leadersOther NGO staff /
NGO workers
Mayors' offices
staff
ANNEX 1. METHODOLOGY
✓Multi-layerinteractivemap(combiningseveralanalysislayersofdifferentfactorsinHaiti)
✓Round12–Keyinformationsheet
✓Round12–Syntheticdataset(onlyavailableinFrench)
✓Detailedreportonthedisplacementsituationinspontaneoussites
✓Listofspontaneoussites(onlyavailableinFrench)
✓Interactivemapofspontaneoussites(onlyavailableinFrench)
✓Coexistenceofinternallydisplacedpersons(IDPs)andhostcommunities,historyandintentionsofIDPs
(onlyavailableinFrench)
✓Keyfindingsfromcomparativeanalysesofthemultisectoralneedsofdisplacedpopulationsandhost
communities(onlyavailableinFrench)
20
ANNEX 2. ACCESS TO OTHER KEY INFORMATION PRODUCTS