
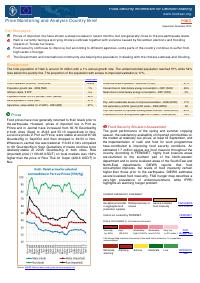
Note de suivi et d'analyse des prix par pays : Haïti, septembre-décembre 2010
Résumé — Note de suivi des prix pour Haïti, financée par l'Union européenne et préparée par la FAO, couvrant septembre-décembre 2010, signalant une forte hausse des prix du riz importé tout en restant globalement proche des niveaux d'avant le séisme. Elle documente une épidémie de choléra préoccupante conjuguée à des violences liées aux élections de novembre et aux dégâts de l'ouragan Tomas.
Constats Clés
- La note de suivi des prix de septembre-décembre 2010 indique que les prix du riz importé avaient fortement augmenté au cours des derniers mois mais restaient généralement proches des niveaux d'avant le séisme.
- Les prix du riz importé à Port-au-Prince et à Jacmel sont passés de 36,76 gourdes par kg en septembre à 45,93 et 55,13 gourdes par kg respectivement en novembre.
- Les prix du riz local à Port-au-Prince sont restés autour de 87,28 gourdes par kg en septembre et octobre avant de tomber à 84,53 gourdes par kg en novembre, tandis que le riz local à Jacmel atteignait 110,23 gourdes par kg en novembre.
- La note indique que la sécurité alimentaire s'améliorait grâce aux bonnes campagnes de printemps et d'été, à une disponibilité satisfaisante des produits importés à des prix relativement bas jusqu'en septembre, et aux programmes argent et nourriture contre travail.
- La section sécurité alimentaire estimait toutefois 1,7 million de personnes en insécurité alimentaire dans le pays, avec une insécurité alimentaire sévère localisée et des niveaux supérieurs à ceux d'avant le séisme.
- La production céréalière totale de 2010 était prévue à 502.000 tonnes, soit 9 pour cent sous la production de 2009 mais 8 pour cent au-dessus de la moyenne quinquennale, avec des besoins d'importation 2010-2011 de 711.000 tonnes.
Texte Intégral du Document
Texte extrait du document original pour l'indexation.
Food Security Information for Decision Making
www.foodsec.org
European Union
Price Monitoring and Analysis Country Brief
Haiti
September-December 2010
Key Messages
Prices of imported rice have shown a steep increase in recent months, but are generally close to the pre-earthquake levels.
Haiti is currently facing a worrying cholera outbreak together with violence caused by November elections and flooding
impacts of Tomas hurricane.
Food security continues to improve, but according to different agencies, some parts of the country continue to suffer from
high levels of hunger.
The Government and international community are helping the population in dealing with the cholera outbreak and flooding.
Background
The total population of Haiti is around 10 million with a 1% annual growth rate. The undernourished population reached 57% while 54%
lives below the poverty line. The proportion of the population with access to improved sanitation is 17%.
Economic Indicators
Total Population (millions) - 2009 (WB)
View Data
10.033
Food Consumption
Undernourished Population - 2005/2007 (FAO)
57%
Population growth rate - 2009 (WB)
1%
Cereal share in total dietary energy consumption - 2007 (FAO)
46%
GNI per capita, $ PPP
n.a.
Meat share in total dietary energy consumption - 2007 (FAO)
4%
Population below 1$ PPP per day - 2001 (MDGI)
54%
Rural population - 2009 (WB)
51%
Agriculture, value added (% of GDP) - 2003 (WB)
27%
Prices
Food prices have now generally returned to their levels prior to
the earthquake. However, prices of imported rice in Port au
Prince and in Jacmel have increased from 36.76 Gourdes/Kg
in both cities (Sept) to 45.93 and 55.13 respectively in Nov.
Local rice prices in Port au Prince, were stable at around 87.28
Gourdes/Kg in Sept/Oct and then dropped to 84.53 in Nov.
Whereas in Jacmel rice was traded at 110.23 in Nov compared
to 101 Gourdes/Kg in Sept. Quotations of maize continue to be
relatively stable at 22.05 Gourdes/Kg in both cities. Rice
(imported) price (1133.48 USD/T) on local markets was 164%
higher than the price of Rice Thai A1 Super (429.6 USD/T) in
Nov.
Health Indicators
Pop. with sustainable access to improved sanitation - 2008 (WHO)
17%
Life expectancy at birth (years) both sexes - 2008 (WHO)
62
Pop. with access to improved drinking water sources - 2008 (WHO)
63%
Prevalence of HIV among adults aged >= 15 years - 2009 (WHO)
1.9%
Food Security Situation Assessment
The good performance of the spring and summer cropping
season, the satisfactory availability of imported commodities on
the market at relatively low prices, at least till September, and
the implementation of cash and food for work programmes
have contributed to improving food security conditions. An
estimated 1.7 million people are food insecure throughout the
country. According to FEWSNET, highly food insecure areas
are restricted to the southern part of the North-western
department and to some localized areas of the South-East and
North-East departments. GIEWS reports that food
consumption improves, but levels of food insecurity remain
higher than those prior to the earthquake. GIEWS estimates
severe localized food insecurity. FAO hunger map describes a
very high prevalence of undernourishment, while IFPRI
highlights an alarming hunger problem.
CURRENT EMERGENCY ASSESMENT
Exceptional shortfall Widespread lack of
in aggregate food
access
production supplies
Severe localized
food insecurity
Haiti is not covered by FEWSNET.
FAO/GIEWS
CPFS 2010
FEWSNET
SCALE OF HUNGER (% of Undernourishment)
Very high
(>= 35%)
High
(25-34%)
Moderately
Moderately
high (15-24%) low (5-14%)
Very low
FAO
(< 5% under.) Hunger Map
FAO Hunger Map classifies all countries of the world into five based on % of population
undernourished.
Extremely
alarming
Source: GIEWS National basic food prices data and analysis tool
Alarming
Serious
Moderate
Low
IFPRI/2010
GHI
Food Security Information for Decision Making
www.foodsec.org
European Union
Haiti
Vegetation Condition
Food Balance Sheet
At the end of the dry season, normal vegetation conditions are
observed for the major part of the country. The general indicator
of vegetation condition provided below is the relative difference
between the NDVI for December 2010 and the average of the
last 10 years, calculated on the agricultural zones derived from
the GLOBCOVER 2005 database (ESA).
Source: GIEWS Country Briefs
Source: JRC MARS – FoodSec
Government Policies
Crop phase in the reference period
Sowing
Bean (Third)
Growing
Sorghum (Hills)
Harvesting
Rice (Second)
International agencies are supporting the government in
assisting the population with health care facilities, food and non
food items to overcome different emergencies which struck the
country in recent months. After the earthquake an extensive
input support scheme was implemented to support agriculture.
Natural Disasters, Drought and Conflicts
As of January the cholera outbreak has caused 3,651 deaths
and 171,304 infections. The emergency is mainly localized in
the Artibonite and in the Central department. Moreover in Nov
hurricane Tomas resulted in widespread flooding and landslides
which particularly hit the south-west of the country. Political
tensions and voting confusion erupted after the parliamentary
elections in Nov.
Refugees and IDPs
Total in the country
Total outside the country
2007
2008
Consumer and market oriented
measures
n.a.
Producer oriented measures
Support to input for crop production.
Trade policy measures
n.a.
Safety net (increased or introduced)
Food/non food transfers.
Different sources
2009
2
3
23
32539
35737
36015
Source: UNHCR Statistical Online Population Database, United Nations High Commissioner for
Refugees (UNHCR), Data extracted on 01/12/2010.
Disaster Type (last year)
Total cereal production for 2010 was forecast at 502,000 tonnes
representing a 9% drop from 2009 output (553,000 T) but some
8% increase over the five year average (463,000T). Summer
rice production was estimated to be 15% above the 2009 one.
Main maize crop was estimated at 258,000 T. The import
requirements for 2010/2011 marketing year (July-June) are put
at 711,000 tonnes.
Date
Location
Alert
Earthquake
2010-11-12
Ouest
Province
1/3
Earthquake
2010-09-21
Ouest
1/3
Flood
2010-11-05
Western Haiti
1/3
Source: Global Disaster Alert and Coordination System - 3 = 1000 or more people killed or 800000
or more people displaced. 2 = 100 or more people killed or 80000 or more displaced.
Current events to watch (Click to see the full report)
Haiti earthquake: One-year report - Christian's story:...
Aristide can have new passport, Haiti says
Private Sector Development in Haiti: Opportunities for...
Haiti: AmeriCares and Partners Provide Frontline Chole...
Ban calls for ‘raising the cost’ for those who use rap...
For more information, contact: Information-for-action@fao.org
Website: www.foodsec.org
Powered By the GIEWS Workstation
The Programme on Linkin Information and Decision Making to Improve Food Security is funded by
the European Union and implemented by the Food and Agriculture Organization of the United Nations.
Comment citer
Union européenne; Organisation des Nations Unies pour l'alimentation et l'agriculture (FAO), Note de suivi et d'analyse des prix par pays : Haïti, septembre-décembre 2010, https://reliefweb.int/attachments/81bbe50b-6f5b-3c92-aabc-9bc1f0786fcf/55E561F39F27B20CC125782D0051343E-Full_Report.pdf