Teks Konple Dokiman an
Teks ki soti nan dokiman orijinal la pou endeksasyon.
Raju Jan Singh
Mary Barton-Dock
Systematic Country Diagnostic
Haiti
Toward a New Narrative
Haiti Toward a New Narrative Jan Singh and Barton-Dock
Public Disclosure Authorized
Public Disclosure Authorized
Public Disclosure Authorized
Public Disclosure Authorized
Haiti
Toward a New Narrative
Raju Jan Singh
Mary Barton-Dock
© 2015 International Bank for Reconstruction and Development / The World Bank
1818 H Street NW, Washington, DC 20433
Telephone: 202-473-1000; Internet: www.worldbank.org
Some rights reserved
1 2 3 4 18 17 16 15
This work is a product of the staff of The World Bank with external contributions. The findings,
interpretations, and conclusions expressed in this work do not necessarily reflect the views of The World
Bank, its Board of Executive Directors, or the governments they represent. The World Bank does not
guarantee the accuracy of the data included in this work. The boundaries, colors, denominations, and
other information shown on any map in this work do not imply any judgment on the part of The World
Bank concerning the legal status of any territory or the endorsement or acceptance of such boundaries.
Nothing herein shall constitute or be considered to be a limitation upon or waiver of the privileges and
immunities of The World Bank, all of which are specifically reserved.
Rights and Permissions
This work is available under the Creative Commons Attribution 3.0 IGO license (CC BY 3.0 IGO) http://
creativecommons.org/licenses/by/3.0/igo. Under the Creative Commons Attribution license, you are
free to copy, distribute, transmit, and adapt this work, including for commercial purposes, under the
following conditions:
Attribution—Please cite the work as follows: Singh, Raju Jan and Mary Barton-Dock. 2015. Haiti:
Toward a New Narrative. Systematic Country Diagnostic. Washington, DC: World Bank. License: Creative Commons Attribution CC BY 3.0 IGO
Translations—If you create a translation of this work, please add the following disclaimer along with the
attribution: This translation was not created by The World Bank and should not be considered an official
World Bank translation. The World Bank shall not be liable for any
content or error in this translation.
Adaptations—If you create an adaptation of this work, please add the following disclaimer along with
the attribution: This is an adaptation of an original work by The World Bank. Views and opinions expressed in the adaptation are the sole responsibility of the author or authors of the adaptation and are not endorsed by The World Bank.
Third-party content—The World Bank does not necessarily own each component of the content
contained within the work. The World Bank therefore does not warrant that the use of any third-party-
owned individual component or part contained in the work will not infringe on the rights of those third
parties. The risk of claims resulting from such infringement rests solely with you. If you wish to re-use
a component of the work, it is your responsibility to determine whether permission is needed for that
re-use and to obtain permission from the copyright owner. Examples of components can include, but are
not limited to, tables, figures, or images.
All queries on rights and licenses should be addressed to the Publishing and Knowledge Division, The World
Bank, 1818 H Street NW, Washington, DC 20433, USA; fax: 202-522-2625; e-mail: pubrights@worldbank.org.
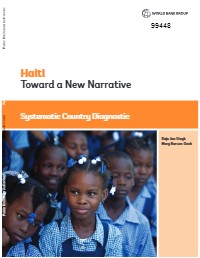
Cover photo: © World Bank. Further permission required for reuse.
Cover design: Florencia Micheltorena.
iii
Contents
Acknowledgments. . . . . . . . . . . . . . . . . . . . . . . . . . . . . . . . . . . . . . . . . . . . . . . . . . . . . . . . . . . . . . . . .vii
Abo
ut the Authors
. . . . . . . . . . . . . . . . . . . . . . . . . . . . . . . . . . . . . . . . . . . . . . . . . . . . . . . . . . . . . . . . . .x
Abbre
viations
. . . . . . . . . . . . . . . . . . . . . . . . . . . . . . . . . . . . . . . . . . . . . . . . . . . . . . . . . . . . . . . . . . . . . xi
Map. . . . . . . . . . . . . . . . . . . . . . . . . . . . . . . . . . . . . . . . . . . . . . . . . . . . . . . . . . . . . . . . . . . . . . . . . . . . xiii
Executive Summary. . . . . . . . . . . . . . . . . . . . . . . . . . . . . . . . . . . . . . . . . . . . . . . . . . . . . . . . . . . .1
Coun
try Profile: What Makes Haiti Haiti ?
. . . . . . . . . . . . . . . . . . . . . . . . . . . . . . . . . . . . . . . . . . . . 1
Trend
s and Profile in Poverty and Shared Prosperity
. . . . . . . . . . . . . . . . . . . . . . . . . . . . . . . . . . . 3
Trend
s and Drivers of Growth
. . . . . . . . . . . . . . . . . . . . . . . . . . . . . . . . . . . . . . . . . . . . . . . . . . . . . . 4
Sust
ainability
. . . . . . . . . . . . . . . . . . . . . . . . . . . . . . . . . . . . . . . . . . . . . . . . . . . . . . . . . . . . . . . . . . . . 5
Prior
ities
. . . . . . . . . . . . . . . . . . . . . . . . . . . . . . . . . . . . . . . . . . . . . . . . . . . . . . . . . . . . . . . . . . . . . . . . 6
1. Country Profile. . . . . . . . . . . . . . . . . . . . . . . . . . . . . . . . . . . . . . . . . . . . . . . . . . . . . . . . . . . . . . . .9
Opp
ortunities and a Vision
. . . . . . . . . . . . . . . . . . . . . . . . . . . . . . . . . . . . . . . . . . . . . . . . . . . . . . . . 9
A Brok
en Social Contract
. . . . . . . . . . . . . . . . . . . . . . . . . . . . . . . . . . . . . . . . . . . . . . . . . . . . . . . . . . 9
Veste
d Interests
. . . . . . . . . . . . . . . . . . . . . . . . . . . . . . . . . . . . . . . . . . . . . . . . . . . . . . . . . . . . . . . . . 12
Polit
ical Instability and Violence
. . . . . . . . . . . . . . . . . . . . . . . . . . . . . . . . . . . . . . . . . . . . . . . . . . . 19
Natura
l Disasters
. . . . . . . . . . . . . . . . . . . . . . . . . . . . . . . . . . . . . . . . . . . . . . . . . . . . . . . . . . . . . . . . 21
Migrat
ion
. . . . . . . . . . . . . . . . . . . . . . . . . . . . . . . . . . . . . . . . . . . . . . . . . . . . . . . . . . . . . . . . . . . . . . 22
Limite
d Data. . . . . . . . . . . . . . . . . . . . . . . . . . . . . . . . . . . . . . . . . . . . . . . . . . . . . . . . . . . . . . . . . . . . 26
2
. Trends and Profile in Poverty and Shared Prosperity. . . . . . . . . . . . . . . . . . . . . . . . . . . . . . 29
Trend
s
. . . . . . . . . . . . . . . . . . . . . . . . . . . . . . . . . . . . . . . . . . . . . . . . . . . . . . . . . . . . . . . . . . . . . . . . . 29
Driver
s
. . . . . . . . . . . . . . . . . . . . . . . . . . . . . . . . . . . . . . . . . . . . . . . . . . . . . . . . . . . . . . . . . . . . . . . . . 34
3. Trends and Drivers of Growth. . . . . . . . . . . . . . . . . . . . . . . . . . . . . . . . . . . . . . . . . . . . . . . . . . 43
Trend
s
. . . . . . . . . . . . . . . . . . . . . . . . . . . . . . . . . . . . . . . . . . . . . . . . . . . . . . . . . . . . . . . . . . . . . . . . . 43
Driver
s
. . . . . . . . . . . . . . . . . . . . . . . . . . . . . . . . . . . . . . . . . . . . . . . . . . . . . . . . . . . . . . . . . . . . . . . . . 49
4. Sustainability. . . . . . . . . . . . . . . . . . . . . . . . . . . . . . . . . . . . . . . . . . . . . . . . . . . . . . . . . . . . . . . . 61
Enviro
nment
. . . . . . . . . . . . . . . . . . . . . . . . . . . . . . . . . . . . . . . . . . . . . . . . . . . . . . . . . . . . . . . . . . . 61
Socia
l Tensions
. . . . . . . . . . . . . . . . . . . . . . . . . . . . . . . . . . . . . . . . . . . . . . . . . . . . . . . . . . . . . . . . . . 62
Macroe
conomy
. . . . . . . . . . . . . . . . . . . . . . . . . . . . . . . . . . . . . . . . . . . . . . . . . . . . . . . . . . . . . . . . . 64
Recent P
rogress in Poverty Reduction
. . . . . . . . . . . . . . . . . . . . . . . . . . . . . . . . . . . . . . . . . . . . . . 67
5. Priorities. . . . . . . . . . . . . . . . . . . . . . . . . . . . . . . . . . . . . . . . . . . . . . . . . . . . . . . . . . . . . . . . . . . . 71
Prior
itization Process
. . . . . . . . . . . . . . . . . . . . . . . . . . . . . . . . . . . . . . . . . . . . . . . . . . . . . . . . . . . . 71
Quan
titative Assessment
. . . . . . . . . . . . . . . . . . . . . . . . . . . . . . . . . . . . . . . . . . . . . . . . . . . . . . . . . 71
Quali
tative Assessment
. . . . . . . . . . . . . . . . . . . . . . . . . . . . . . . . . . . . . . . . . . . . . . . . . . . . . . . . . . . 75
iv Contents
Five Priority Areas for Policy Action. . . . . . . . . . . . . . . . . . . . . . . . . . . . . . . . . . . . . . . . . . . . . . . 81
Data Ga
ps
. . . . . . . . . . . . . . . . . . . . . . . . . . . . . . . . . . . . . . . . . . . . . . . . . . . . . . . . . . . . . . . . . . . . . . 85
Referen
ces
. . . . . . . . . . . . . . . . . . . . . . . . . . . . . . . . . . . . . . . . . . . . . . . . . . . . . . . . . . . . . . . . . . . . . 87
Appe
ndix A: Price Comparison Analysis
. . . . . . . . . . . . . . . . . . . . . . . . . . . . . . . . . . . . . . . . . . . 93
Appe
ndix B: Bottlenecks and Correlates of Firm Productivity
. . . . . . . . . . . . . . . . . . . . . . . . 95
Appe
ndix C: Most Significant Data Gaps in Haiti
. . . . . . . . . . . . . . . . . . . . . . . . . . . . . . . . . . . 97
Boxes
1.1 Common Features of PIM in Donor-Dependent Countries. . . . . . . . . . . . . . . . . . . . . . . . 13
1.2 Product Market Concentration Analysis. . . . . . . . . . . . . . . . . . . . . . . . . . . . . . . . . . . . . . . . 19
2.1 Gender Inequalities in Haiti. . . . . . . . . . . . . . . . . . . . . . . . . . . . . . . . . . . . . . . . . . . . . . . . . . 35
3.1 Petrocaribe and Haiti. . . . . . . . . . . . . . . . . . . . . . . . . . . . . . . . . . . . . . . . . . . . . . . . . . . . . . . . 45
4.1 Drivers of Conflict in Haiti—An Empirical Analysis. . . . . . . . . . . . . . . . . . . . . . . . . . . . . 65
4.2 Electricité d’Haïti (EDH). . . . . . . . . . . . . . . . . . . . . . . . . . . . . . . . . . . . . . . . . . . . . . . . . . . . . 68
5.1 Benchmarking the Drivers of Shared Prosperity: An Application to Haiti. . . . . . . . . . . 73
5.2 Conflict and Welfare Spending in Haiti: What Could We Learn from Cross-Country
Evidence?. . . . . . . . . . . . . . . . . . . . . . . . . . . . . . . . . . . . . . . . . . . . . . . . . . . . . . . . . . . . . . . . . . 76
5.3 Bank-Sponsored Competition of Academic Papers. . . . . . . . . . . . . . . . . . . . . . . . . . . . . . . 78
Figures
1.1 Inclusiveness. . . . . . . . . . . . . . . . . . . . . . . . . . . . . . . . . . . . . . . . . . . . . . . . . . . . . . . . . . . . . . . 10
1.2 Competition Intensity and Extent of Market Dominance, 2014–15. . . . . . . . . . . . . . . . . 17
1.3 Business Risks Related to Weak Competition Policies (by Components). . . . . . . . . . . . . 18
1.4 Concentration Levels Based on HHI in the 18 Most Important Haitian
Product Markets, 2012. . . . . . . . . . . . . . . . . . . . . . . . . . . . . . . . . . . . . . . . . . . . . . . . . . . . . . . 20
1.5 Vulnerability Index, 2013 (Average Score of Susceptibility, Coping and
Adaptive Capacity). . . . . . . . . . . . . . . . . . . . . . . . . . . . . . . . . . . . . . . . . . . . . . . . . . . . . . . . . . 23
1.6 Migrants International Comparison, 2010. . . . . . . . . . . . . . . . . . . . . . . . . . . . . . . . . . . . . . 23
1.7 Migrants by Destination Country, 2010. . . . . . . . . . . . . . . . . . . . . . . . . . . . . . . . . . . . . . . . . 23
1.8 Remittances, 2012. . . . . . . . . . . . . . . . . . . . . . . . . . . . . . . . . . . . . . . . . . . . . . . . . . . . . . . . . . . 24
1.9 Foreign Flows, 1998–2012. . . . . . . . . . . . . . . . . . . . . . . . . . . . . . . . . . . . . . . . . . . . . . . . . . . . 25
1.10 Effects of Aid and Transfers on the Trade Balance, 1980–2013. . . . . . . . . . . . . . . . . . . . . 25
1.11 Imports of Goods and Services—LAC Region, 2011–13. . . . . . . . . . . . . . . . . . . . . . . . . . 26
1.12 Merchandise Imports, Aid and Remittances, 2005–14. . . . . . . . . . . . . . . . . . . . . . . . . . . . 27
1.13 Statistical Capacity Indicator, 2014 (0=Lowest, 100=Highest). . . . . . . . . . . . . . . . . . . . . . 27
2.1 Trends in Poverty. . . . . . . . . . . . . . . . . . . . . . . . . . . . . . . . . . . . . . . . . . . . . . . . . . . . . . . . . . . 30
Contents v
2.2 Food Insecurity, 2012. . . . . . . . . . . . . . . . . . . . . . . . . . . . . . . . . . . . . . . . . . . . . . . . . . . . . . . . 34
2.3 Change in Composition of Labor Market, Workforce Ages 15+, 2007–12. . . . . . . . . . . . 36
2.4 Composition of the Labor Market, Workforce Ages 15+, 2012. . . . . . . . . . . . . . . . . . . . . 36
2.5 Breakdown of Haiti’s Population by Labor Status (2012). . . . . . . . . . . . . . . . . . . . . . . . . . 37
2.6 Born Elsewhere, 2011 (Total Population, Area of Living). . . . . . . . . . . . . . . . . . . . . . . . . . 38
2.7 Schooling of Adults Living Outside Department of Birth (15+), 2012. . . . . . . . . . . . . . . 38
2.8 Contribution to Extreme Poverty Reduction. . . . . . . . . . . . . . . . . . . . . . . . . . . . . . . . . . . . 39
3.1 GDP, 1970–2013 (1970 = 100) (Constant 2005). . . . . . . . . . . . . . . . . . . . . . . . . . . . . . . . . . 44
3.2 GDP per Capita, 1970–2013 (1970 = 100) (Constant 2005). . . . . . . . . . . . . . . . . . . . . . . . 44
3.3 Annual GDP Growth vs. Occurrence of Natural Disasters, 1971–2013. . . . . . . . . . . . . . 46
3.4 Annual GDP Growth vs. People Affected by Natural Disasters, 1971–2013. . . . . . . . . . 46
3.5 Annual GDP Growth vs. Changes in Government, 1971–2013. . . . . . . . . . . . . . . . . . . . . 47
3.6 Economic Structure, 1970–2012. . . . . . . . . . . . . . . . . . . . . . . . . . . . . . . . . . . . . . . . . . . . . . . 48
3.7 Decomposition of Value Added Growth by Sector, 1971–2013. . . . . . . . . . . . . . . . . . . . . 49
3.8 Urban Population, 1971–2013. . . . . . . . . . . . . . . . . . . . . . . . . . . . . . . . . . . . . . . . . . . . . . . . . 49
3.9 Obstacles to Growth. . . . . . . . . . . . . . . . . . . . . . . . . . . . . . . . . . . . . . . . . . . . . . . . . . . . . . . . . 50
3.10 Change in Governance Indicators, 2004–13. . . . . . . . . . . . . . . . . . . . . . . . . . . . . . . . . . . . . 52
3.11 Credit by Sector, as of Q2 of 2014. . . . . . . . . . . . . . . . . . . . . . . . . . . . . . . . . . . . . . . . . . . . . . 53
3.12 Logistic Performance Index, 2014 (1=Lowest, 5=Highest). . . . . . . . . . . . . . . . . . . . . . . . . 54
3.13 Port Tariffs Estimated Cost per TEU, 2009. . . . . . . . . . . . . . . . . . . . . . . . . . . . . . . . . . . . . . 54
3.14 Electric Power Consumption, 2011. . . . . . . . . . . . . . . . . . . . . . . . . . . . . . . . . . . . . . . . . . . . 54
3.15 Informal Employment, 2012–22 (Working Age Population 15+). . . . . . . . . . . . . . . . . . . 56
4.1 Population Living in Flood Prone Areas. . . . . . . . . . . . . . . . . . . . . . . . . . . . . . . . . . . . . . . . 62
4.2 Population Exposed to Hurricane Damage—High and Medium Intensity. . . . . . . . . . . 62
4.3 Political Violence, 2003–06. . . . . . . . . . . . . . . . . . . . . . . . . . . . . . . . . . . . . . . . . . . . . . . . . . . 63
4.4 Criminal Activity, 2010–14. . . . . . . . . . . . . . . . . . . . . . . . . . . . . . . . . . . . . . . . . . . . . . . . . . . 63
4.5 Macroeconomic Environment. . . . . . . . . . . . . . . . . . . . . . . . . . . . . . . . . . . . . . . . . . . . . . . . 66
4.6 Effective Exchange Rate, 2006–14. . . . . . . . . . . . . . . . . . . . . . . . . . . . . . . . . . . . . . . . . . . . . . 66
4.7 Central Government Fiscal Balance, 2004–14. . . . . . . . . . . . . . . . . . . . . . . . . . . . . . . . . . . 67
4.8 Current Account Balance, 2004–14. . . . . . . . . . . . . . . . . . . . . . . . . . . . . . . . . . . . . . . . . . . . 67
4.9 International Aid, 2008–25. . . . . . . . . . . . . . . . . . . . . . . . . . . . . . . . . . . . . . . . . . . . . . . . . . . 69
4.10 Government Deposits, 2009–14. . . . . . . . . . . . . . . . . . . . . . . . . . . . . . . . . . . . . . . . . . . . . . . 69
4.11 Petrocaribe Financing, 2008–17. . . . . . . . . . . . . . . . . . . . . . . . . . . . . . . . . . . . . . . . . . . . . . . 69
4.12 Project Activities Financed by Petrocaribe, 2008–13. . . . . . . . . . . . . . . . . . . . . . . . . . . . . . 69
4.13 Histogram of Annual Per Capita Consumption, 2012. . . . . . . . . . . . . . . . . . . . . . . . . . . . . 70
5.1 Prioritization Process. . . . . . . . . . . . . . . . . . . . . . . . . . . . . . . . . . . . . . . . . . . . . . . . . . . . . . . . 72
5.2 Extreme Poverty Simulations. . . . . . . . . . . . . . . . . . . . . . . . . . . . . . . . . . . . . . . . . . . . . . . . . 72
5.3 Economic Magnitude of Estimated Parameters. . . . . . . . . . . . . . . . . . . . . . . . . . . . . . . . . . 74
5.4 Life Expectancy at Birth, 2010. . . . . . . . . . . . . . . . . . . . . . . . . . . . . . . . . . . . . . . . . . . . . . . . . 74
5.5 Cabinet Changes, 2003. . . . . . . . . . . . . . . . . . . . . . . . . . . . . . . . . . . . . . . . . . . . . . . . . . . . . . . 74
5.6 Income Effects of Closing the Gap. . . . . . . . . . . . . . . . . . . . . . . . . . . . . . . . . . . . . . . . . . . . . 75
vi Contents
Maps
2.1 Extreme Poverty Rates by Department, 2012. . . . . . . . . . . . . . . . . . . . . . . . . . . . . . . . . . . . 32
4.1 Violence and Criminal Activity. . . . . . . . . . . . . . . . . . . . . . . . . . . . . . . . . . . . . . . . . . . . . . . . 64
Tables 1.1 Import Quotas for 19 Major Families, 1984–85. . . . . . . . . . . . . . . . . . . . . . . . . . . . . . . . . . 16
1.2 Frequency and Impact of Natural Disasters, 1971–2014. . . . . . . . . . . . . . . . . . . . . . . . . . . 22
2.1 Access to Basic Services—Coverage Rates (2001–12). . . . . . . . . . . . . . . . . . . . . . . . . . . . . 31
2.2 Basic Sociodemographic and Socioeconomic Characteristics of Poor,
Extreme Poor and Nonpoor Households, 2012. . . . . . . . . . . . . . . . . . . . . . . . . . . . . . . . . . 33
3.1 Contributions to Growth (α = 40%). . . . . . . . . . . . . . . . . . . . . . . . . . . . . . . . . . . . . . . . . . . 44
3.2 Haiti’s Governments, 1971–2014. . . . . . . . . . . . . . . . . . . . . . . . . . . . . . . . . . . . . . . . . . . . . . 47
vii
Acknowledgments
We would like to thank the members of
the Haiti Country Team from all Global
Practices, CCSAs, IFC, and MIGA, as well as
all the partners and stakeholders in Haiti
who have contributed to the preparation of
this document in a strong collaborative pro-
cess. We are very grateful for the generosity
exhibited in providing us with substantive
inputs, knowledge and advice, particularly
given the time limitations. The table below
identifies the full list of team members who
have contributed their time, effort and ex-
pertise, and their affiliations.
The team was led by Raju Jan Singh
(Program Leader, LCC8C). The work was
carried out jointly with the IFC (Sylvain
Kakou) and MIGA (Petal Hacket) under
the overall guidance of Mary Barton-Dock
(Special Envoy for Haiti, LCC8C) and Jun
Zhang (Senior Regional Manager for the
Caribbean, IFC).
We wish to thank for their helpful sugges-
tions and insights the Systematic Country
Diagnostic (SCD) peer reviewers, Nancy
Benjamin, Senior Country Economist
(GMFDR), Oscar Calvo-Gonzalez, Program
Leader (LCC2C), and Philip Keefer,
Principal Advisor (IDB), as well as Rolf Parta
for moderating our two-day Country Team
retreat, and Augusto de la Torre (LCR Chief
Economist) and Daniel Lederman (LCR
Deputy Chief Economist) for their advice
throughout the stages of the SCD process.
The SCD not only draws on existing liter-
ature from within and outside the Bank, but
benefitted from the results of the recent
household survey (ECVMAS 2012), as well
as access to the MINUSTAH data on crime
events across Haiti. In this regard, we wish to
express our gratitude to the ONPES, IHSI,
and MINUSTAH for making this possible.
This report also draws heavily on the recent-
ly-completed Poverty Assessment and the
ongoing Public Expenditure Review. In
addition, a number of background papers
have been written by the Country Team on specific themes. In this respect, the Team is appreciative to Prof. James Robinson (Harvard University) and Prof. Suresh Naidu (Columbia University) for discussions on the role of Haitian business elites in Haiti’s de- velopment, and particularly to Lauren Young (Columbia University) for presenting pre- liminary results of their research at the World Bank. We wish also to thank Prof. Cristina Bodea and Masaaki Higashijima (both from Michigan State University) for their work on public spending and conflict.
The analytical work was validated by
wide consultations. In this regard, we wish to thank Bernard Craan, Executive Director of the Private Sector Economic Forum for orga- nizing a meeting with the members of his as- sociation; Delphine Colbeau, UNDP, who coordinated a workshop on violence with the heads of all UN agencies present in Port-au- Prince; Gilles Damais, IDB, for inviting us to present our work at one of its Wednesdays of Reflection with members of the academia, civil society, private sector, and Haitian ad- ministration; Kesner Pharel to provide us with the opportunity to share our ideas on his TV show; and Mariam Yazdani from Vivario for interesting discussions on gang dynamics. We are also very grateful to
Hans-Muller Thomas, Kore Fanmi National
viii Acknowledgments
Coordinator, Germanite Phanord, Kore
Fanmi Regional Coordinator, and Jean
Raynold Saint Hilaire, Chief Social Worker
for organizing our field trip to the com-
munes of Boucan Carré and Thomassique,
Central Plateau Department, as well as to the
National Association of Haitian Professionals
for having invited us at Harvard University
for their Third Annual Conference with the
Haitian diaspora.
Finally, we wish to thank Ricardo
Augustin (Dean, School of Economics—
Notre Dame University of Haiti), Raulin
Cadet (Dean, School of Economics Dean—
Quisqueya University), Fritz Deshommes
(Deputy Dean of the State University of
Haiti), Amos Durosier (Dean, Advanced
Commercial and Economic Studies
Institute), and Lionel Metellus (Dean,
Quisqueya American University Institute)
for setting up our competition of academic
papers (“The Twin Goals Awards”), as well
as all the members of our Selection
Committee from Haiti: Henri Bazin
(President, Haiti Conciliation and
Arbitration Chamber), Charles Cadet
(Ministry of Economy and Finance, Haiti),
Kathleen Dorsainvil (American
University), Fritz Jean (President, North
East Chamber of Commerce, Haiti), Eddy
Labossière (President, Association of
Haitian Economists) and Guy Pierre
(Autonomous University of Mexico), and
from the World Bank: Dorsati Madani
(Senior Economist, GMFDR), Gael
Raballand (Senior Public Sector Specialist,
GGODR), and Erik von Uexkull (Country
Economist, GMFDR). A special thanks
should be given to all our participants from
Haiti, Canada and the United States, but
particularly to our laureates: Jose Minerve
Cayo (State University of Haiti), Jean
Ribert Francois (State University of Haiti),
Carl-Henri Prophète (Centre d’Études
Diplomatiques et Internationales, CEDI),
Alendy Saint-Fort (FDSE), Jean Carrington
Saintima (IHECE), and Guimard Syvrain
(CTPEA).
Acknowledgments ix
Haiti SCD team
Global practice/cross-cutting area Team members
Agriculture Pierre Olivier Colleye, Katie Freeman, Christophe Grosjean, Eli Weiss
Communication Christelle Chapoy, Berdine Edmond
Education Melissa Adelman, Juan Baron, Axelle Latortue
Energy and extractives Susana Moreira, Remi Pelon, Frederic Verdol
Environment Nyaneba Nkrumah
Finance and markets Juan Buchenau, Caroline Cerruti
Governance Alexandre Berg, Mamadou Deme, Onur Erdem, Sheila Grandio, Fabienne
Mroczka
Haiti CMU Mary Barton-Dock, Pierre Bonneau, Gabrielle Dujour, Nellie Sew Kwan Kan,
Michelle Keane, David Lighton, Deo Ndikumana, Raju Singh, Kanae Watanabe,
Paula White
Health, nutrition and population Eleonora Cavagnero, Sunil Rajkumar
IFC Ary Naim, Sylvain Kakou, Lina Sun Kee, Jean Francois Pean, Frank Sader,
Jun Zhang
Macroeconomics and fiscal
management
Kassia Antoine, Calvin Djiofack, Evans Jadotte, Julie Lohi, Sandra Milord,
Konstantin Wacker
MIGA Petal Hacket
Poverty Facundo Cuevas, Federica Marzo, Aude-Sophie Rodella, Thiago Scot
Social protection Lucy Bassett, Carine Clert, Maki Noda
Social, urban, rural and resilience Ali Alwahti, Paul Blanchard, Sylvie Debomy, Sergio Dell’Anna, Joan Fomi, Van
Anh Vu Hong, Oscar Ishizawa, Peter Lafere, Michel Matera, Bernhard Metz,
Claudia Soto Orozco, Rafael Van der Borght, Gaetano Vivo, Javier Sanchez-
Reaza, Alys Willman
Trade and competitiveness Babatunde Abidoye, Massimiliano Cali, Emiliano Duch, Tanja Goodwin, Maria
Kim, Martha Licetti, Siobhan Murray, Georgiana Pop, Lucia Jimena Villaran,
Joaquin Zentner
Transport and ICT Malaika Becoulet
Water and sanitation Jean-Martin Brault
x
Raju Jan Singh is the program leader for
Haiti, leading and overseeing the World Bank’s
work on economic policy, private sector de-
velopment, and education and social pro-
tection, and was previously sector leader
and lead economist on Central
African
states, stationed several years in Yaoundé, Cameroon. Prior to joining the World Bank, Raju was working as a senior economist and mission chief at the International Monetary Fund, where he held positions in the Fiscal Affairs, Asian and Pacific, and African De- partments, working on a wide range of countries and leading missions to China, Cyprus, and Tonga. He has been an advisor in the Swiss Executive Director Office, and worked at the Swiss
Finance Administration
in Bern, as well as at Lombard Odier & Cie (private banking) in Geneva. He has also been a consultant for the Swiss Agency for Development and Cooperation, working with the central banks of Rwanda and Tan- zania, and has taught at the Graduate Institute of International Studies in Geneva. He has published on a wide set of issues, including
fiscal decentralization and public finance, banking, trade, and remittances. Raju holds a master’s degree and a doctorate in eco- nomics from the Graduate Institute of Inter-
national Studies in Geneva.
Mary Barton-Dock is the special envoy and
director for Haiti. Prior to taking this posi-
tion, she was the director of climate change
and environment for the World Bank. She
has also served as the country director
for Cameroon, Chad, the Central African
Republic, Equatorial Guinea, Gabon, and
São Tomé and Principe. Prior to becoming
a country director, she was the manager of
the World Bank’s Agriculture, Environment,
and Social Development programs in West
Africa. In addition, she has been the World
Bank’s resident representative in Chad, and
the team leader from programs in Southern
Africa. Prior to joining the Africa region,
she also worked in South East Asia, and she
started her career with the World Bank
working on Bolivia. Mary holds a master’s
degree in public policy from Harvard.
About the Authors
xi
Abbreviations
ACD Armed Conflict Dataset
ACLED Armed Conflict Location & Event Data
ASCUYDA Automated System for Customs Data
BMPAD � Bureau de Monétisation du Programme d’Aide au Développement (Bureau of
Monetization of Development Aid Programs)
CCRIF Caribbean Catastrophe Risk Insurance Facility
CPIA Country Policy and Institutional Assessment
CSCCA � Cour Supérieure des Comptes et du Contentieux Administratif (Supreme Court
of Accounts and Contentious Administrative Proceedings)
DHS Demographic Health Survey
DINEPA �Direction de l’Eau Potable et de l’Assainissement (Water and Sanitation
Authority)
DR Dominican Republic
ECVMAS Enquête des Conditions de Vie des Ménages (Household survey)
EDE PÈP Social Assistance Program “Help the People”
EDH Electricité d’Haiti (Public Electricity Company)
EM-DAT Emergency Events Database
FDI foreign direct investment
FSAP Financial Sector Assessment Program
GCI Global Competitiveness Index
GDP gross domestic product
HELP Haiti Economic Lift Program
HHI Herfindahl-Hirschman Index
HIPC highly indebted poor country
HNP Haiti National Police
HS Harmonized Coding System
HTG Haitian gourde
IFC International Finance Corporation
IHSI Institut Haïtien de Statistique et d’Informatique (Haiti’s Statistical Institute)
IICA Inter-American Institute for Cooperation on Agriculture
IMF International Monetary Fund
IPPs independent power producers
LAC Latin America and Caribbean
LIC low income countries
LPI Logistics Performance Index
LSCI Liner Shipping Connectivity Index
MDG Millennium Development Goals
MDRI Multilateral Debt Relief Initiative
xii Abbreviations
MEF Ministry of Economy and Finance
MENFP Ministère de l’Education Nationale (Ministry of Education)
MINUSTAH United Nations Stabilization Mission in Haiti
MSMEs
micro, small, and medium enterprises
MSPP � Ministère de la Santé Publique and de la Population (Ministry of Public Health
and Population)
NEER nominal effective exchange rate
NGOs non-governmental organizations
ODA official development assistance
OECD Organization for Economic Cooperation and Development
ONPES Observation Nationale de la Pauvreté et l’Exclusion Sociale
PARDH � Plan d’Action pour le Relèvement et le Développement d’Haiti (Action Plan for
the Recovery and Development of Haiti)
PDNAs Post-Disaster Needs Assessments
PIM public investment management
PIP Public Investment Program
PIU Project Implementation Units
POVCALNET Online Poverty Analysis Tool—World Bank
PPP public-private partnership
PSDH � Plan Stratégique de Développement d’Haiti (Strategic Plan for Development of
Haiti)
REER real effective exchange rate
PRSP Poverty Reduction Strategy Paper
SAM Social Accounting Matrix
SCD Systematic Country Diagnostic
SCI Statistical Capacity Indicator
TEU twenty foot equivalent units
TFP total factor productivity
UN United Nations
WDI World Development Indicators
WEF World Economic Forum
WHO World Health Organization
xiii
Map
To
Monte Christi
Chaine de la Selle
(2680 m )
Île de
la Gonâve
C
e
n
t
r
a
l
P
l
a
t
e
a
u
M
a
s
s
i
f
d
e
l
a
H
o
t
t
e
NORD - OUEST
NORD
NORD - EST
ARTIBONITE
CENTRE
OUEST
SUD - EST
SUD
GRANDE-
ANSE
Gros-Morne
Limbé
Ennery
Grande Rivière
du Nord
Saint- Raphaël
Verrettes
Croix des Bouquets
Petit- Goâve
Belle- Anse
Thiotte
Côtes-de-fer
Vieux Bourg d'Aquin
Les Anglais
Camp-Perrin
Miragoâne
Mirebalais
Ferrier
Trou-
du-Nord
Saint Michel de l'Attalaye
Maïssade
Léogâne
Les Trois
A
r t i b
o
n i t e
Guayam
p u o
Jacmel
Hinche
Gonaives
Fort-Liberte
NORD - OUEST
NORD
NORD - EST
ARTIBONITE
CENTRE
OUEST
SUD - EST
SUD
GRANDE-
ANSE
NIPPES
Palmiste
Môle St.-Nicolas
Baie de
Henne
Gros-Morne
Limbé
Ennery
Grande Rivière
du Nord
Saint-
Raphaël
Verrettes
Pointe-à-Raquette
Croix des
Bouquets
Marigot
Petit-
Goâve
Belle-
Anse Thiotte
Côtes-de-fer
Vieux Bourg
d'Aquin
Roseaux
Anse d'Hainault
Les Anglais
Port-Salut
Camp-Perrin
Anse-à-Galets
La Cayenne
Mirebalais
Ferrier Trou-
du-Nord
Saint Michel
de l'Attalaye
Maïssade
Léogâne
Jacmel
Hinche
Jeremie
Gonaives
Les Cayes
Cap-Haitien
Fort-Liberte
Port-de-Paix
Miragoâne
PORT-AU-PRINCE
DOMINICAN
REPUBLIC
Les Trois
A
r t i b
o
n i t e
Guayam
p u o
ATLANTIC OCEAN
Caribbean Sea
W
i
n
d
w
a
r
d
P
a
s
s
a
g
e
Golfe de
la Gonâve
Lago
Enriquillo
Étang
Saumâtre
Lac de
Péligre
To
Monte
Christi
To
Santiago
To
San Juan
To
Barahona
To
Oviedo
Île à Vache
Grande
Cayemite
Île de
la Gonâve
Île de la Tortue
C
e
n
t
r
a
l
P
l
a
t
e
a
u
M
a
s
s
i
f
d
e
l
a
H
o
t
t
e
Chaine de la Selle
(2680 m )
20°N
74°W
74°W
W°27 W°37
W°27 W°37
18°N
19°N
20°N
18°N
HAITI
This map was produced by the Map Design Unit of The World Bank.
The boundaries, colors, denominations and any other information
shown on this map do not impl y, on the pa rt of The World Bank
Group, any judgment on the legal status of any territo ry, or any
endorsement or acceptance of such boundaries.
0
10
20
30
0
10
20
30 Miles
40 Kilometers
HAITI
SELECTED CITIES AND TOWNS
DEPARTMENT CAPITALS
NATIONAL CAPITAL
RIVERS
MAIN ROADS
RAILROADS
DEPARTMENT BOUNDARIES
INTERNATIONAL BOUNDARIES
Executive Summary 1
Haiti has a vision to become an emerg-
ing economy by 2030. Haiti’s geography,
resources, and history provide it with oppor-
tunities. The country has comparative advan- tages, including its proximity and access to major markets; a young labor force and a
dynamic diaspora; and substantial geo-
graphic, historical, and cultural assets. Areas of economic opportunity for Haiti include agribusiness, light manufacturing and tour- ism. Building on these opportunities, the Government of Haiti issued in May 2012 a Strategic Development Plan (PSDH), aiming at building a new modern, diversified, resil- ient, competitive and inclusive economy, re- spectful of its environment and in which people’s basic needs are met. This objective would require ambitious double digit growth rates, a significant break from the past, based on an expansion of agriculture, construction, manufacturing, and tourism.
Overall, Haiti’s growth performance in
the last four decades has been disappointing, however, and poverty remains endemic. A history of vested interests, political instabil- ity, and natural disasters has prevented the country from realizing its aspirations, trap- ping the country in a low equilibrium and keeping it as one of the poorest and least equal countries in the world. GDP per capita fell by 0.7 percent per year on average be- tween 1971 and 2013. As a result, in 2012 59 percent of Haitians remained poor and 24 percent suffered from extreme poverty, indicating that almost 6.3 million Haitians could not meet their basic needs and 2.5 mil- lion could not even cover their food needs.
This Systematic Country Diagnostic
(SCD) seeks to identify the most important constraints to and opportunities for inclusive and sustainable growth in Haiti. To identify the key constraints to Haiti’s growth and shared prosperity, an extensive review of the literature (from both within and outside the World Bank) was first carried out. Economic and sector work on Haiti produced in 1980s and the early 1990s had already identified most of the country’s challenges and demon- strated that better functioning institutions, stronger human capital, and improvements in infrastructure were all needed for Haiti’s economic growth and shared prosperity. Rather than listing these again, this report attempts to provide some prioritization and identify the most binding constraints, both quantitatively and through a series of consultations with stakeholders and the country team.
Country Profile: What
Makes Haiti Haiti ?
A social contract is missing between the
State and its citizens. While overall income
growth is a necessary condition for increas-
ing shared prosperity, it is not sufficient.
Growth that is inclusive of the poor requires
additional mechanisms such as a pro-poor
fiscal regime, as well as targeted social pro-
grams and expenditures, not only to redis-
tribute resources towards the poor but also
more importantly to ensure that the less
well-off are an integral part of the process
Executive Summary
2 Executive Summary
and that opportunities improve for all.
Previous reports have noted, however, that
Haiti has never had a tradition of providing
services to the population or creating an en-
vironment conducive to sustainable growth.
Haiti’s tax system generates limited resources
for the government and tends to be regres-
sive. Furthermore, public spending in health,
education, and social protection remains
limited, constraining the government’s abil-
ity to provide services and offer equal oppor-
tunities to its citizens. In the absence of
government, basic services such as health
and education are mainly provided by non-
government actors, placing a substantial fi-
nancial burden on households and delivering achievements closely linked with household income.
The reliance on non-government actors
has also weakened public investment
management. Haiti’s public investment man-
agement exhibits a number of distinctive fea- tures and practices common to countries that are aid-dependent, including weak
appraisal capacity and reliance on donors
to design good projects, hampering the
effective use of public resources. Sectoral
strategies to guide the prioritization of
projects are lacking. This leads to a Public
Investment Program composed of projects that are neither fully assessed nor prioritized. Furthermore, there is no effective ex-ante control on disbursements based on the phys- ical progress of projects against plans. While progress is being made in fiscal reporting by rolling out the use of a single treasury ac- count, domestically-funded capital expendi- tures are not yet properly accounted for, tracked and reported, creating an environ- ment conducive to a lack of transparency and accountability.
The structure of the private sector shows
signs of high degrees of concentration, hampering the entry of new actors and re- sulting in high prices for consumers. From the beginning of the twentieth century, au- tocratic leaders in Haiti have traded politi- cal support from the elite for economic advantages to this elite. Though publicly available information on privately held businesses is limited, many of the same families who dominated the Haitian econ- omy during the era of Duvalier in the 1970s and the 1980s seem to remain in control of large segments of the economy today, re- sulting in high concentration in a number of key industries, distorted competition, and non-transparent business practices in many instances. Several of the most impor-
tant food products in the Haitian consump- tion basket are sold in concentrated markets, and a preliminary analysis indi- cates that the prices of these products are on average about 30–60 percent higher in Haiti than in other countries from the re- gion. This translates into limited opport
unities for a substantial expansion of the
formal private sector across most sectors. Few of Haiti’s established private firms have modern capital and governance structures with professional management, limiting their access to long-term financing.
Political violence has occurred regularly
throughout Haiti’s history, leading to insta- bility. At Independence in 1804, Haiti was at the forefront of history, being the first na- tion to abolish slavery. Since then, however, with some exceptions such as the 30-year
period of autocratic rule under Francois
Duvalier (Papa Doc) and his son Jean- Claude Duvalier (Baby Doc) (1957–86), Haiti has known a succession of short-lived
Executive Summary 3
governments. Lacking sufficiently long peri-
ods of stability, the country has struggled
to develop the institutional mechanisms
and policy fundamentals essential to eco-
nomic development and the rule of law.
Disenfranchised and without effective chan-
nels to voice needs and demands, citizens
have taken to the streets in protest, some-
times violently. While violent airing of griev-
ances in Haiti’s early history generally took
place in the rural areas, contemporary unrest
tends to break out in the cities, reflecting the
country’s demographic evolution and urban-
ization over the years. Against this backdrop,
the post-earthquake period has been com-
paratively stable.
Furthermore, the Haitian population is
one of the most exposed in the world to
natural disasters—hurricanes, floods and
earthquakes. Between 1971 and 2013, Haiti’s economy has been subjected to natural di- sasters almost every year with adverse effects on growth. The country has a higher number of disasters per km
2
than the average of
the Caribbean countries. In 2008, tropical storms and hurricanes caused losses esti- mated at 15 percent of GDP. The earthquake on January 12, 2010 killed 220,000 people, displaced 1.5 million people, and destroyed the equivalent of 120 percent of GDP.
In this unfavorable environment, migra-
tion has become a key avenue for Haitians seeking a better life. Substantial internal mi- gration is taking place, particularly from rural to urban areas, as people seek better economic opportunities and better services. In addition, for both political and economic reasons, large numbers of Haitians have emi- grated throughout the twentieth century building an important diaspora. A vast ma- jority of Haitians who continue to emigrate
now seem to do so because they cannot find work opportunities in Haiti. This large dias- pora is a significant source of remittances: remittances received by Haiti are the highest among Latin America and Caribbean (LAC) countries in terms of GDP and the fourth highest in the world in terms of export earnings.
Trends and Profile in
Poverty and Shared
Prosperity
While remaining high, poverty has de -
clined in Haiti. Recent findings indicate that
extreme poverty has declined in Haiti from
31 percent of the population in 2000 to 24
percent in 2012. Progress was mainly con-
centrated in urban areas, however. This trend
is confirmed by both monetary and non-
monetary poverty indicators, with the big-
gest non-monetary progress recorded in
education. All school-age children go to
school in about 90 percent of the households
compared to about 80 percent in 2001.
Immunization rates are also up.
Recent evidence suggests that this decline
in extreme poverty was driven by labor
income, private transfers, and aid. Non-
agricultural labor income increased by about 3½ percent on average per year, especially among men, with expansions in construc- tion, telecommunication and transport, all concentrated in urban areas. Formal employ- ment remains small (13 percent of the labor force) with agriculture and urban informal sectors still providing most of the employ- ment with about 40 percent and 47 percent of the labor market, respectively. Workers’ transfers from abroad have represented more
4 Executive Summary
than a fifth of Haiti’s GDP in recent years,
and the percentage of households receiving
private transfers (domestic transfers or re-
mittances from abroad) in Haiti increased
from 42 percent to 69 percent between 2000
and 2012. Furthermore, the 2010 earthquake
resulted in unprecedented aid flows in the
form of money, goods and services. These
external flows have also contributed in re-
ducing poverty over the period, especially
in the metropolitan area which attracted
most of the assistance (in large part because
Port-au-Prince was hit hardest by the
earthquake).
Trends and Drivers of
Growth
Overall, Haiti’s growth performance in
the last four decades has been disappointing.
From 1971 to 2013, GDP growth averaged
1.2 percent a year, much lower than the aver-
age of the LAC region (3.5 percent) and the
average of economies at the same level of de-
velopment (3.3 percent). The few periods of
positive growth were short-lived, often fol-
lowed by a contraction in economic activity.
Furthermore, in light of the country’s impor-
tant demographic growth, the level of GDP
per capita even fell by 0.7 percent per year
on average between 1971 and 2013. Whereas
low income countries (LICs) have on average
seen their GDP per capita taking off since
the mid-1990s, Haiti was left behind.
Political instability and natural disasters
have taken a toll on growth. Despite invest-
ment and increases in the labor force, Haiti’s
growth performance has remained weak, re-
flecting the natural disasters and political in-
stability the country has experienced. The
departure of Jean-Claude Duvalier initiated
a period of intense political instability in
Haiti. Between 1986 and 2014 the country
had 18 changes of president and important
changes in regime. Such political instability
has often been accompanied by violence and
a continuous weakening of state institutions,
the rule of law, and the investment climate,
undermining investor confidence.
Uncertainty as to whether investors can ob-
tain returns from their investments rep-
resents one of the main constraints to growth
in Haiti. Political instability has also resulted
in a trade embargo in the first half of the
1990s that crippled private sector activities.
Haiti’s business environment is hampered
by institutional weaknesses. Although gover-
nance indicators have improved, Haiti still
ranks lowest in the region in control of
corruption or government effectiveness.
Efficient mechanisms for international
arbitration and mediation are lacking.
Guarantees for the protection of investors’ private property rights are insufficient. Legal and regulatory frameworks are fragmented and dysfunctional. In particular, a real prop- erty cadaster and land registry system is needed. Furthermore, access to finance is challenging for both, households and me- dium- and small-sized enterprises.
Haiti’s infrastructure also falls short.
Island economies are extremely dependent on the quality, frequency and cost of the means of transport that link them to markets which represent both outlets for their prod- ucts and supply sources for the needed im- ported goods. The efficiency and effectiveness of transport, whether by road, by sea, or by air, therefore strongly affects their competi- tiveness. The quality of transport and logistics services in Haiti is low, however, with large parts of the territory still poorly connected. Recent evidence indicates, for instance, that
[... middle sections omitted for long document ...]
Appendix C: Most Significant Data Gaps in Haiti 97
Sector/
theme
Data sets/survey
descriptions
Frequency Comments
Cross sectoral data
GAP Population census Every 10 years Last available 2003—Planned but not budgeted
for in 2015.
GAP Continuous employment/
labor survey
Yearly Last available 2003—Urban only if nationwide
not achievable (should include informal sector)
GAP Yearly vital statistics report Yearly Births, deaths, causes of death and basic
demographics—Requires institutional
strengthening on collection of data at various
institutions
Poverty data
Periodic GAP Poverty assessment Every 5 years Last available 2014/2015.
GAP Poverty headcount by
section communal
TBD Data on poverty at national level exists, but not
for each communal section. Important to make
spatial link between risk and poverty.
Public financial and governance data
Ongoing but
many GAPs
Regular reporting on
government financial data,
especially; public investment
expenditures commitments,
and final payments; local
government financial data
consolidated financial data
for State owned enterprises
Monthly Supported by a variety of donors, but broadly
unavailable.
GAP Data on special public
programs/funds
Yearly PSUGO, FER, FNE, etc.
GAP Public Expenditure and
Financial Accountability
Survey (PEFA)
Periodicity TBC Latest available 2011 (EU)
GAP Survey on governance and
corruption
Periodicity TBD Latest available 2007, 2011 (Government
Anti-Corruption Unit)
Economic data
GAP Rebase GDP Periodic (long term)
GAP Social Accounting Matrix
update
Periodicity TBD Last available 1986
table continues next page
Appendix C: Most Significant Data Gaps
in Haiti
98 Appendix C: Most Significant Data Gaps in Haiti
Sector/
theme
Data sets/survey
descriptions
Frequency Comments
Education data
GAP School census Yearly Needs to be of good quality. Current surveys
don’t meet quality standards needed for
adequate use. Must include infrastructure
questions for Water and Sanitation and schools
characteristics.
Planned Cartography of all schools Baseline 2015
Yearly update
Baseline will be started by IDB January 2015.
Health data
Periodic GAP Demographic and Health
Survey (DHS)
Mini-DHS (in between)
Every 5 years
Every 5 years
Last available DHS 2012
Periodic GAPHealth facility census Every 3 years Last available 2013. Quality needs improvement
GAP Detailed data set on
government and donor
programs
TBD Includes (a) geographical commune level
information on programs, (b) commodities
provided, (c) personnel hired (including type),
(d)
spending (per category of spending). Baseline
to be developed.
Periodic GAP Health system indicators
collection
TBD Collected from National Health Information System, SNIS, include inputs (Human resources, equipment, drugs, etc.), outputs (number of key procedures, consultations, etc.) and intermediate outcome indicators.
GAP Improved surveillance systems disease control
TBD Building on cholera surveillance systems to track signs of epidemic outbreaks and enable rapid response.
Data for disaster risk analysis and prevention
Ongoing High resolution digital
elevation model
Ongoing—WB
financing
Light detection and ranging, using an airborne
laser techniques to densely sample the surface
of the earth and produce highly accurate
topographic models
Ongoing National Emergency Shelter
Survey
Ongoing—WB
financing
Information needed: functional survey and
ad-hoc structural assessment of all the shelters
used in case of emergency; scope countrywide
Ongoing Natural Hazards Risk Atlas Ongoing—WB
financing
First Atlas, will summarize all the major risks
to
non-practitioners with a resolution of
1:100,000 scale
Ongoing Baseline assessment of
hydro-meteorological (including marine) and climate data
Planned—WB Financing
Estimated available in 2017–2018
Ongoing Systematic and consolidated
meteorological and hydrological/hydrogeological database
System and baseline planned—WB financing
Estimated available in 2017–2018. Will require long term engagement of Government and partners.
Ongoing Updated return period for
select hazards
Planned—WB financing
Periodicity of storm; wind; storm surge.
Appendix C: Most Significant Data Gaps in Haiti 99
Sector/
theme
Data sets/survey
descriptions
Frequency Comments
GAP National public and private
critical facilities survey and
assessment
TBD Assessment of resilience of schools, hospitals,
critical administrative offices such as police
station, etc., to disaster risk (Earthquakes,
Floods, Hurricanes).
Financial sector data
Ongoing
baseline
Periodic GAP
FINDEX survey on financial
inclusion
Baseline ongoing—
WB financing
Ongoing Financial capabilities survey Planned—WB
financing
GAP Enterprise survey TBD Survey should provide data about firm
financing, covering also the informal sector.
GAP FinScope surveys TBD In depth surveys about demand and use of
financial services (e.g., carried out among
households and MSMEs)
GAP MixMarket datasets or
similar surveys
TBD Provide financial data about the structure and
performance of all financial cooperatives and
microfinance entities and data on the
composition and performance of their loan
portfolios.
Agriculture data
GAP Agricultural census Every 5 years Last available 2008 raw data made available
recently (FAO). But design and methodology
was poor, data is out of date and may not be
usable. Survey needs to be consistent across
years and digitally collected.
Periodic GAP Update/validation of
agricultural census/
agricultural survey
Yearly Must use representative samples. IHSI
tasked
with annual updates but lacks ability
to carry out.
GAP Time-series satellite imagery
TBD Remote sensing to collect data on crop cover, and crop rotations by seasons and years
GAP Market information survey agricultural goods
TBD Stock and flows of agricultural goods by department, including consumption, imports, exports and goods sold into local markets.
Ongoing Updated and scaled-up the
National Farmer Registry
Ongoing—WB financing
Completion date baseline TBD.
Water data
Planned Comprehensive country
baseline for water supply
Planned—WB
financing
Information: boreholes, water networks,
household connections, kiosks, etc., and how
many people are served by these; Level of detail:
community level for the whole territory.
Planned National Sanitation Baseline
Survey
Planned—WB
financing
Information required: open defecation, improved
vs. non improved toilets, collective vs. individual
septic tanks, etc., Level of detail: community
level for the whole territory.
table continues next page
100 Appendix C: Most Significant Data Gaps in Haiti
Sector/
theme
Data sets/survey
descriptions
Frequency Comments
GAP Survey for water availability
in schools and health
facilities
Periodic TBD Latest available 2009 from Ministry of
Education survey of public and private schools.
Confirm whether imminent IDB survey of
schools includes the water and sanitation.
Transport and infrastructure data
Ongoing Rural access index Ongoing—WB
financing
Includes condition of the road networks, road
density, and provide reliable geo-referenced and
structured road network data.
Haiti Toward a New Narrative
SKU K8422