Teks Konple Dokiman an
Teks ki soti nan dokiman orijinal la pou endeksasyon.
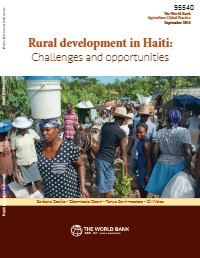
Rural development in Haiti:
Challenges and opportunities
The World Bank
Agriculture Global Practice
September 2014
Barbara Coello • Gbemisola Oseni • Tanya Savrimootoo • Eli Weiss
95540
Public Disclosure Authorized
Public Disclosure Authorized
Public Disclosure Authorized
Public Disclosure Authorized
Barbara Coello
Gbemisola Oseni
Tanya Savrimootoo
Eli Weiss
Rural development in Haiti:
Challenges and opportunities
The World Bank
Agriculture Global Practice
September 2014
Standard Disclaimer
This volume is a product of staff of the International Bank for Reconstruction and
Development/ The World Bank. The findings, interpretations, and conclusions
expressed in this paper do not necessarily reflect the views of the Executive Directors
of The World Bank or the governments they represent. The World Bank does not
guarantee the accuracy of the data included in this work. The boundaries, colors,
denominations, and other information shown on any map in this work do not imply
any judgment on the part of The World Bank concerning the legal status of any
territory or the endorsement or acceptance of such boundaries.
Copyright Statement
The material in this publication is copyrighted. Copying and/or transmitting
portions or all of this work without permission may be a violation of applicable
law. The International Bank for Reconstruction and Development/ The World
Bank encourages dissemination of its work and will normally grant permission to
reproduce portions of the work promptly.
For permission to photocopy or reprint any part of this work, please send a
request with complete information to the Copyright Clearance Center, Inc., 222
Rosewood Drive, Danvers, MA 01923, USA, telephone 978-750-8400, fax 978-750-
4470, http://www.copyright.com/.
All other queries on rights and licenses, including subsidiary rights, should
be addressed to the Office of the Publisher, The World Bank, 1818 H Street NW,
Washington, DC 20433, USA, fax 202-522-2422, e-mail pubrights@worldbank.org
Photo credit: Eli Weiss, World Bank, 2013
Acknowledgement
The authors would like to thank Federica Marzo, Diego Arias and Michael Morris
for their guidance and advice during the elaboration of this paper.
Contents
Excecutive Summary....................................................................................................iv
1. I
ntroduction and Background
.................................................................................1
2. Data Sources..............................................................................................................4
3. Profile of Rural Households.....................................................................................6
3.1. C
haracteristics of Rural Households
.................................................................7
3.2. Economic Activities of Rural Households........................................................12
3.2.1 Agriculture..................................................................................................16
3.2.2 Nonfarm Activities....................................................................................22
3.2.3 Other Income and Remittances...............................................................25
4. Determinants of Rural Income Generating Activities..........................................28
5. Determinants of Market Access..............................................................................34
6. D
eterminants of Participation in Nonfarm Activities
..........................................38
7. Determinants of Poverty and Food Insecurity......................................................42
8. Key Findings and Recommendations.....................................................................46
8.1. Promoting Diversification of Livelihoods
Sources among Rural Households.....................................................................47
8.1.1 Findings......................................................................................................47
8.1.2 Recommendations.....................................................................................48
8.2. Improving the Performance of Rural Markets for Inputs and Outputs
........................................................................................50
8.2.1 Findings......................................................................................................50
8.2.2 Recommendations.....................................................................................50
9. References..................................................................................................................54
Appendix.......................................................................................................................58
Executive Summary
Haiti is one of the least developed countries in the world and has faced many
challenges in its development process due to its vulnerability to natural disasters
and fragility. The frequent natural disasters are particularly devastating because they
directly affect the large share of the population that lives in rural areas and depends
on agriculture as a primary livelihood source. Approximately 50 percent of Haiti’s
population of 10 million currently reside in rural areas, and according to recent
figures about 70.7 and 53.9 percent of rural households are poor (income of less
than $1.98 per day) or extremely poor (income of less than $1.00 per day). Haiti’s
rural population remains one of the most food insecure in the world. Ecological
challenges, rapid population growth, and high import dependency, combined with
the devastating effects of the 2010 earthquake, have exacerbated an already dire
food insecurity situation, and revitalization of the agricultural sector has become
a foremost priority of the Haitian government. The nonfarm sector in Haiti is also
important for the rural economy and contributes to improved livelihoods of rural
households.
The objective of this report is to examine the linkages between rural economic
activity, food insecurity and poverty in Haiti as a means of determining the barriers
to rural development. The analysis draws on a newly available set of household-
level living standards measurement data collected in 2012 (ECVMAS). About
70.7 percent of all rural households are poor, and education levels are low with an
average of 2.8 years of education for the household head. Agriculture dominates
economic activity (78 percent of all households are involved in agricultural
activities), although almost 25 percent of the agricultural households supplement
their agricultural income by engaging also in some type of nonfarm activity. Overall
nonfarm activity participation (including households that engage in agricultural
activities and households that do not) is reported at 46 percent. Nonfarm activities
can be related to agriculture upstream (input supply) or downstream (value-adding
and processing), or they can be unrelated to the sector (retailing). This report
identifies the main factors of production that correlate with increased productivity
in the agricultural sector and examines the determinants of nonfarm participation,
poverty and food security within rural Haiti.
Key Findings and Recommendations
The information and analysis presented in this report point to two priority areas
for rural development interventions in Haiti: (i) promoting diversification of
livelihoods sources among rural households, and (ii) improving the performance
of rural markets for inputs and outputs. Focusing on these areas could increase
agricultural productivity, boost rural incomes, improve food security, thereby
potentially reducing constraints to rural development.
iv
I. Promoting Diversification of Livelihoods Sources
a
mong Rural Households
Findings
•
Diversifying agricultural production activities is correlated with higher
p
roductivity and could reduce vulnerability to shocks.
•
Remittances are positively associated with higher incomes, increased agricultural
productivity, and improved food security, but the causal relationships are difficult to discern.
•
Nonfarm activities in rural areas seem to provide a pathway to escape from
poverty and food insecurity.
• Female headed households have reduced access to farming inputs, which could
explain the observed gender gap in input use and agricultural productivity. In the nonfarm enterprise sector, female headed households similarly have reduced access to inputs and use lower quantities of inputs.
Recommendations
•
Promote diversification of agricultural production activities as a way to incr
ease income and improve food security. Activities that could be undertaken
to promote diversification include educational campaigns to increase awareness of the benefits of diversification, research to identify crops and livestock species suited for particular locations or production environments, extension activities to disseminate locally appropriate management methods, and programs to improve the availability and accessibility of key inputs. Nevertheless, farmers might also be able to expand productivity / increase income on a single crop, if they select to invest in crops that provide higher profits.
•
Help poor rural households take advantage of non-farm employment
opportunities as a way of generating additional revenue and managing risk. Special consideration should be given to interventions that will help the poorest households overcome entry barriers (lack of key assets and access to basic services, and distance to markets and labor), including not only interventions designed to improve the quality of the rural labor force (e.g., basic education, vocational training), but also interventions designed to generate increased rural non-farm employment opportunities (e.g., programs to encourage expansion of rural enterprises, support to rural financial institutions).
•
Encourage poor rural households to invest remittances in improving the
productivity of their agricultural activities. Poor rural households receiving
remittances often use those remittances to purchase food, and as a result they miss an opportunity to build the base of productive assets needed to generate an enhanced stream of income over the longer term. Interventions are needed to encourage poor rural households invest a portion of the remittances they may receive in productive assets that can ensure a longer term stream of future income.
v
• I
of the natural resource base on which agriculture depends. Over the longer
term, the welfare of rural households in Haiti will depend crucially on the
quality of the natural resource base on which agriculture depends. Efforts are
needed to compensate for decades of mismanagement, with the goal of reversing
land degradation, restoring soil fertility, re-establishing vegetative cover, and
conserving and protecting increasingly scarce water resources. A place to begin
would be through the promotion of more environmentally friendly agricultural
production practices, combined with introduction of regulations to restrict the
uncontrolled exploitation of common-pool resources especially including trees.
These could be complemented in time with schemes to promote payments for
environmental services (PES), which led to good results in some countries and
could provide opportunities for rural households to generate additional income
by preserving the environment.
II.
I
for Inputs and Outputs
Findings
•
A
and high cost of purchased inputs.
• For many rural households, incentives to invest in improved agricultural
productivity are undermined by lack of access to reliable markets for outputs.
Recommendations
•
S
availability of improved inputs.
a. For seeds, modern varieties hold the potential to deliver significant yield
increases in virtually all of the major staples. Seed production and marketing
are by nature commercial activities, but newly established private seed
companies face many obstacles and may require public support during an
initial phase. This support should come in two forms: (i) public investments
that lower R&D costs of private companies (e.g., investments in public
plant breeding research and public production of foundation seed), and (ii)
enactment of policies that favor the emergence of a pluralistic and competitive
seed industry.
b.
For fertilizer, stimulating the development of an efficient, profitable, and
competitive fertilizer industry would require a two-pronged approach to strengthen demand for fertilizer on the one hand and improve the supply of fertilizer on the other. Possible interventions include measures that would improve the ability of farmers to access credit needed to purchase fertilizer, as well as scale up the use of fertilizer vouchers to make fertilizer more affordable
vi
to the poorest farmers. It is important that these programs be time-bound,
however, to ensure that subsidies can be phased out as the quantities used
of fertilizer increase and commercial distribution becomes profitable. Efforts
to strengthen demand for fertilizer must be accompanied by parallel efforts
to improve supply. Fertilizer market development efforts should be aimed at
creating viable private production and distribution systems. As with seed,
public support may be needed during an initial phase to allow emerging private
fertilizer companies to become established and expand their operations to
a commercially viable scale, but this support should be time-bound. Haiti
lacks the raw materials needed to produce fertilizer, so the domestic fertilizer
industry will rely for the foreseeable future on imported components. The
government should promote private investment in the industry, but it should
avoid directly participating in importing and distributing fertilizer.
•
Improve access of rural households to output markets. Many rural households
in Haiti have little incentive to invest in expanding their agricultural enterprises because of the difficulty of selling surplus production. Efforts are needed to reduce the transactions costs incurred by rural households in identifying and accessing remunerative markets for outputs. An initial set of interventions could focus on different types of mobile phone- and internet-based market information systems that speed flows of market information and help connect buyers and sellers. Such efforts will have to be complemented with investments in infrastructure— especially rural roads—that can allow households located in remote areas to access inputs and evacuate outputs quickly and at lower cost.
•
Exploit immediate opportunities to match supply and demand. Development
of efficient markets for agricultural commodities in Haiti will take time. In the short run, however, opportunities exist to link selected producers with remunerative markets, such as food aid programs, school feeding initiatives, and other institutional feeding schemes that can systematically source products from local producers. One promising approach that has been used successfully in many other countries to tackle this multi-pronged agenda is the Productive Alliances model that links producer groups to markets.
•
Strengthen food safety through regulations and implementing institutions.
As Haiti’s food system transitions from its current subsistence orientation to become more market-oriented, food quality and safety will become increasingly important for public health and competitiveness. A comprehensive food safety strategy covering the entire supply chain “from farm to fork” would help to ensure that investments in improving food quality and nutritional content are sustained over time. Such a strategy should raise awareness about food safety and nutrition issues, provide production and market incentives, and develop the appropriate policy and institutional framework needed to ensure the availability
of the necessary infrastructure and supporting services.
vii
Introduction and Background
1
1Rural development in Haiti: Challenges and opportunities
1. H
challenges due to its fragile resource base, vulnerability to natural disasters,
and political instability. The economic challenges Haiti faces today are
similar in many respects to those highlighted 15 years ago in the 1999 World
Bank Haiti Poverty Assessment. The 1999 report indicated that among the
two-thirds of the population classified as rural, as many as 80 percent lived
in poverty, including more than 65 percent who lived in extreme poverty.
Haiti also suffered from high rates of child malnutrition and low educational
achievements
1
(World Bank 1998). Today, very little has changed: about 50
2
percent of the Haitian population of almost 10 million people resides in
rural areas where development indicators are lagging and poverty is more
widespread. The most recent figures
3
indicate that about 70.7 percent of rural
households fall into the “poor” category (based on the moderate poverty line
of $1.98 per day), and about 53.9 percent fall into the “extreme poor” category
(based on a poverty line of $1.00 per day
4
). The main economic activities of rural
households also remain relatively unchanged. Although households in rural
Haiti engage in multiple income generating activities, as in many developing
countries, the agriculture sector employs more than 70
5
percent of the rural
population and contributes about 28 percent to GDP (World Bank 2008). As
is becoming more common in many developing countries, households in rural
areas often diversify outside agriculture, and the importance of the nonfarm
sector continues to grow (Barrett et al. 2001). This is also the case in Haiti,
where about 45 percent of rural households engage in the nonfarm sector.
2.
Haiti’s rural population remains extremely poor and food insecure. In rural
Haiti, 7 out of 10 people live in poverty, a rate that is higher than the rate found in any other country in the region (World Bank Data). While countries such as Honduras, Guatemala, Nicaragua, and Bolivia also experience rural poverty rates over 50 percent, most other Latin American and Caribbean countries experience rates below 50 percent. In comparison, the rate of rural poverty stands at about 56 percent in Malawi and Mozambique and at about 30 percent in Ethiopia. The high levels of rural poverty in Haiti are reflected in widespread food insecurity: about 36 percent of the rural population suffers from food insecurity. According to the Global Food Security Index, Haiti ranks near the bottom of the table in food
1 A
suffered from malnutrition.
2 In contrast the 2003 census showed that about 60 percent of the population was
classified as rural (WB 2005)
3 See Chapter 1: Poverty profile and trends, Haiti Poverty Assessment 2014
4 Both the moderate and extreme poverty rates are based on exchange rate of 41.58
HTG to the US dollar (2012).
5 Except when indicated, all statistics are from the Enquête sur les Conditions de Vie
de Ménage Après le Séisme (ECVMAS 1), conducted in 2012-2013 by the National
Bureau of Statistics of Haiti, l’Institut Haïtien de Statistique et d’Informatique
(IHSI), see paragraph 5 below for more details
2
security
6
(The Economist, 2014). It ranks dead last within the Latin American
region, and it is one of the worst performers even when compared to other low
income countries such as Niger, Bangladesh, and Uganda.
3. The agriculture sector in Haiti is adversely affected by high rates of
population growth and harsh environmental conditions. Agriculture remains the mainstay of the rural economy in Haiti. The main food crops are rice, maize, bananas, yams, cassava, green beans, and millet, while important export crops include coffee and mangoes. Production is highly dependent on unreliable rainfall, as fewer than 1 percent of farmers use irrigation (Jadotte 2007). Most farmers have poor access to tools, machinery, and purchased inputs including improved seeds and fertilizer. Many have difficulty connecting to markets due to transportation constraints and poor infrastructure (WB 2005). In a country that is already densely populated, steady population growth continues to put pressure on the natural resource base, and farm sizes have declined over time and become less productive (WB 2005). To compound matters, Haiti’s exposure to frequent hurricanes and tropical storms, combined with high rates of soil erosion that have reduced soil fertility and adversely affected crop output, cause annual productivity losses in agriculture ranging from 0.5 to 1.2 percent (WB 2005). Extensive deforestation
7
in many parts of the country has worsened the
erosion problem and led to the loss of enormous quantities of fertile topsoil (Verner 2008; WB 2005).
4.
Haiti is highly dependent on international markets for its food security,
importing more than 50 percent of its food including 80 percent of the main staple, rice (USAID 2014, WB 2014 and figure A1). The 2008 global food price crisis caused food prices in Haiti to spike sharply. Higher food prices were particularly harmful to the poor, more than 50 percent of whose expenses are dedicated to food. Food supply shortages are believed to have caused irreversible effects on human health, even though these effects are difficult to quantify. The 2008 experience highlighted the dependence of Haiti on food imports and its vulnerability to fluctuations in international prices.
8
The 2008 food price crisis was followed by a series of severe storms in 2008 and widespread devastation to the nation’s capital caused by the earthquake in 2010. The large quantities of emergency food aid that were imported in response to these crises had unintended negative impacts on Haitian agriculture, as food prices fell precipitously in local markets. These events discouraged investment in Haitian farming,
9
but at the same time they also led to some urban-to-
6 H
three dimensions: affordability, availability, quality and safety.
7 Haiti forest cover less than 2 percent of the country (Country profile, Library of
congress federal research division)
8 Former President Bill Clinton apologize in the Senate Foreign Relations Committee
about the consequences of US rice subsidies inducing a loss of capacity for Haitian
farmers to continue producing rice (March 10, 2010)
9 John Holmes (U.N. humanitarian chief) in The Associated Press and former
Director-General of UN Food and Agriculture Organization (FAO) Jacques Diouf
Introduction and Background
3Rural development in Haiti: Challenges and opportunities
rural migration as people abandoned Port-au-Prince. This confluence of
reduced food supply and increased rural demand created an incentive for
the government to attribute increased importance to rural development as a
national development objective (Shamsie 2012). Today, rebuilding the nation’s
agricultural production base ranks among the top priorities of the government
10
(Arias et al., 2013). Promoting development of the rural nonfarm sector is also
considered important, as an expanding nonfarm sector could absorb surplus
unproductive labor as it exits from the agricultural sector, slowing rural-to-
urban migration while at the same time creating opportunities to increase
household income (Lewis 1954 and Verner 2008).
5.
The Ministry of Agricultural Resources and Rural Development (MARNDR)
has implemented important agriculture policy reforms. In 2010, the Government implemented a short- to medium-term strategy and investment plan for the period 2013-16. The plan identifies four main objectives for the agricultural sector: (i) modernize the ministry of agriculture to enable better governance; (ii) increase agricultural productivity to improve food security and increase revenue; (iii) develop agricultural value chains, with particular emphasis on increasing exports; and (vi) adopt and promote ecological agriculture to preserve natural resources. Other major agricultural policy reforms have started to changed the way direct support to farmers is handled. For the first time, subsidies to agricultural inputs are being provided through voucher schemes, which are less distortionary than traditional subsidies applied across the board to input prices. The use of vouchers has encouraged increased participation by the private sector in the provision of inputs, allowing for a general positive spillover effect on non-beneficiaries. Finally, ongoing efforts have been made in strengthening the capacity of key institutions charged with the provision of agricultural public goods and services, in particular in the areas of animal and plant health, but also in the areas of research and development (R&D) and extension.
10 Th
includes (a) increasing the productivity and competitiveness of the agricultural
sector, (b) increase by 25 percent the contribution of agriculture productivity to
national food availability, (c) Reduce by 50 percent the number of individuals in
food insecurity, (d) Increase agricultural income for at least 500,000 households,
(e) Increase resilience of the population to natural hazard.
4
Data Sources
2
5Rural development in Haiti: Challenges and opportunities
6. This r
and poverty in Haiti takes advantage of a new and unique data set
11
. The
analysis presented below is based on data from the first wave of the panel
survey, Enquête sur les Conditions de Vie de Ménage Après le Séisme (ECVMAS
1), conducted in 2012-13 by the National Bureau of Statistics of Haiti, l’Institut
Haïtien de Statistique et d’Informatique (IHSI) in collaboration with the
World Bank and the French research institution, Développement, Institutions
et Mondialisation (DIAL). The survey follows the typical Living Standards
Measurement Study (LSMS) framework. The survey sample was designed to
be representative at the national, departmental and rural/urban levels. The full
ECVMAS sample includes 4,960 households, both urban and rural, drawn
from 500 enumeration areas. For the purpose of this chapter, the analysis has
been restricted to the rural sub-sample, which includes 2,296 households from
287 enumeration areas.
7.
One of the main objectives of ECVMAS 1 is to capture key socio-demographic
and socio-economic characteristics of the population. ECVMAS 1 contains comprehensive data on employment and unemployment, agricultural and non-agricultural economic activities of the household, primary and secondary economic activities of the individuals, housing conditions, consumption spending, migration, shocks as well as coping mechanisms. The ECVMAS data enables a closer look at crop, livestock and other agricultural activities of the 80 percent of rural households engaged in agriculture. Detailed information was also gathered on the nonfarm sector, focusing on areas such as industry of activity, size of enterprise, ownership, and destination of products.
12
8.
The availability of such comprehensive data on post-earthquake Haiti
allows us to gauge with greater accuracy the current living conditions and socio-economic profiles of rural Haiti and to help determine some of the potential barriers to rural development. Section 2 presents a detailed profile of rural households in Haiti and their food security status. Section 3 examines the economic activities of rural household both in the farm and nonfarm sectors. Section 4 presents analysis on the determinants of rural income generating activities in Haiti and explores the role of remittances. The analysis also examines the factors that matter for poverty and food security of rural household in general and agricultural households in particular. Section 5 concludes by summarizing key findings and policy implications.
11
the first wave of the ECVMAS survey.
12 The ECVMAS has some limitation on the quality and accuracy of the data, which
would have been useful for this study, such as data on soil, productivity, access to
irrigation, credit or localization.
6
Profile of Rural Households
3
7Rural development in Haiti: Challenges and opportunities
9. This
reports on the economic activities of these households, and examines the
correlates to poverty. For present purposes, Haiti’s 10 departments are grouped
into four regions:
13
Nord, Sud, Transversale, and Ouest.
3.1
C
10. R
households, for example those found in the Port-au-Prince (PAP) region. Using a poverty line of $1.98/day, 70.7 percent
14
of all rural households are
categorized as poor (Figure 2.1). The rural poverty rate ranges from a low of 59.8 percent in Ouest region to a high of 82.8 percent in Nord region. These variations are likely due in part to the regions’ respective physical proximities to urban centers such as PAP, the Ouest being the closest and the Nord the most remote. About 53 percent of the rural population lives in extreme poverty, surviving on less than $1.00/day. The rate of extreme rural poverty is highest in Nord region, where over 67 of the population lives in extreme poverty. Female- headed households experience marginally higher rates of extreme poverty and food insecurity than male-headed households.
11.
Education levels are low in rural Haiti, with an average of 2.8 years of
education for the household head. Education levels are slightly higher in Ouest region compared with the other regions, where household heads have 3.5 years of education on average and about 51 percent are literate (Table A1). This is not unexpected as the Ouest region has the highest share of non-poor rural households. Education levels reflect a gender gap: male household heads report more years of schooling compared to female household heads (3.4 vs 1.9).
13 H
Nord, Nord-Est, Nord-Ouest, Ouest, Sud-Est, and Sud. The department with
the highest share of rural households is Sud-Est with 85.1 percent of households
classified as rural. This is followed by the Nippes department with 82.2 percent
rural households, the Centre department with 80.6 percent, the Sud department
with 78.5, and the Grand’Anse department with 77.8 percent rural. The Ouest
department, home to the nation’s capital Port-au-Prince,has the lowest share
of rural households by far with just 20.6 percent of households classified as
rural. Although, Ouest has the lowest share of rural households, due to its high
population it has the highest number of rural households. The departments are
grouped in 4 regions as follows: 1. Nord : Nord, Nord-Est and Nord-Ouest; 2. Sud :
Grand’Anse, Nippes and Sud; 3.Transversale: Artibonite and Centre and 4. Ouest:
Ouest and Sud-Est. The 5
th
region, Aire Metropolitaine, is not relevant to rural
analysis and therefore not represented in this chapter.
14
The poverty rate of 70.7 percent is based on the rural sub-sample used in the
analysis in this chapter.
8
Figure 2.1: Poverty and Food Insecurity Status of Rural Households
12. I
15
found in rural
Haiti (94.3 percent)
translates to an almost 1:1 person pressure on the
productive population. While the dependency ratio provides some insight
into the household composition, it can be misleading. In the case of Haiti
especially, the dependency ratio as conventionally defined does not necessarily
reflect the labor dynamics of rural households, where individuals past the age
of retirement (65 years) often continue to engage in economic activities. In
Haiti, 58 percent of individuals past the age of 65 still contribute actively to the
household economy. Households with high dependency ratios are frequently
poor, which is supported by the data from Ouest region, which has the lowest
dependency ratio (87.6 percent) (Table A1).
15 Th
age group of 15-64 divided by the number of individuals in the working age group.
The dependency ratio is different from the ‘economic dependency ratio,’ which
takes into account the entire working population regardless of age.
All Rural
Region Gender
of head
Nord
Transversale
Female Headed
Sud
Ouest
Male Headed
Poverty Extreme Poverty Food Insecurity
0 10 20 30 40 50 60 70 80 90
Profile of Rural Households
9Rural development in Haiti: Challenges and opportunities
Table 2.1a.: Household Characteristics (Percentage unless otherwise noted)
All Rural
Household Head is male 61.5
Age of household head 49.4
Household Head Edu (years) 2.8
Household Head is literate 45.9
Household head in committed relationship 65.5
Household size 4.9
Number of children under 5yrs old 0.6
Dependency Ratio
1
94.3
Per capita Annual Consumption (HTG)
2
30695.5
Observations 2261
1. Dependency ratio is based on 2154 hhs, since 107 hhs reported no adults of working age.
2. The computed annual consumption is based on Oct 2012 prices and is also geographically deflated.
13.
Rural households in Haiti have poor access to infrastructure, such as
e
lectricity, safe water sources, and adequate waste disposal systems (Table
2.1b). Although most rural households own their dwelling, the dwellings tend to
be constructed using inferior materials, and many are considered precarious
16
.
A
ccess to electricity in rural Haiti is very limited, with the highest levels of
home electrification (22.2 percent) occurring in Ouest region. The region with
the greatest access to clean water needed for drinking and for use in household
activities such as cooking and cleaning is the Ouest, with about 65.3 percent
and 41.3 percent of households reporting access to safe water sources for these
two categories. Low penetration of key infrastructure in rural Haiti is a direct
constraint on the country’s ability to reach its Millennium Development Goals.
14.
Non-poor households are better educated, smaller in size, and characterized
by lower dependency ratios. Among households classified as non-poor, per capita annual consumption expenditures (HTG 62,319) are more than three times higher than per capita annual consumption expenditures in poor households (HTG 17,624) (Table 2.2a). A greater proportion of non-poor households (40.9 percent) reported experiencing earthquake-related damage to their dwellings than poor households (33 percent), which could be due to the closer proximity of many non-poor households to the hard-hit urban centers. Poor households tend to live in lower quality dwellings, with less access to infrastructure and public services (Table 2.2b).
16 Dwellings are defined as precarious if the structure is made from cheap materials
s
uch as homes with thatch roofs, mud walls, palm leave doors and usually
with minimal open air cooking facilities, or if it is assembled from discarded
construction materials, in tents or temporary shelters.
10
Table 2.1b.: Housing Characteristics (Percentages unless otherwise noted
All Rural
Ownership of dwelling 84.3
Dwelling is considered precarious 18.0
Number of rooms 2.7
Walls are mostly made of bricks/stone or cement 49.0
Roof is mainly cement 5.6
Flooring is mainly cement or ceramic/mosaic 46.0
Main source of cooking fuel is wood 81.8
Main source of lighting is electricity 12.1
Main drinking water source is from a protected or safe source
1
56.9
No toilet system (nature) 36.5
Observations 2261
The safe source includes any treated water source or naturally safe such as artesian wells.
Table 2.2a.: Household Characteristics by Poverty Status (Percentages unless otherwise noted)
All Rural Non Poor Poor Difference ttest
4
Household Head is male 61.5 60.4 61.9 1.5
Age of household head 49.4 48.8 49.7 0.9
Household Head Edu (years) 2.8 4.5 2.1 -2.4***
Household Head is literate 45.9 60.7 39.8 -20.8***
Household head in committed relationship 65.5 55.0 69.8 14.7***
Household size 4.9 3.5 5.5 2.0***
Number of children under 5yrs old 0.6 0.3 0.8 0.5***
Dependency Ratio
1
94.3 58.5 108.8 50.3***
Per capita Annual Consumption (HTG)
2
30,695 62,272 17,621 -44,651.6***
House was damaged in earthquake 35.4 40.9 33.0 -7.9***
Observations
3
2261 707 1554
1. Dependency ratio is based on 2154 hhs. 107 hhs reported no adults of working age.
2. The computed annual consumption is based on Oct 2012 prices and is also geographically deflated.
3. The number of observations of poor and non-poor is unweighted
4. Note: Significance levels are *** p<0.01, ** p<0.05, * p<0.1
Profile of Rural Households
11Rural development in Haiti: Challenges and opportunities
Table 2.2b.: Housing Characteristics by Poverty Status (percentages unless otherwise noted)
All Rural Non Poor Poor Difference ttest
3
Ownership of dwelling 84.3 77.3 87.1 9.8***
Dwelling is considered precarious 18.0 13.4 19.9 6.5***
Number of rooms 2.7 2.8 2.6 -0.2**
Walls are mostly made of bricks/stone or cement 49.0 63.7 42.8 -20.9***
Roof is mainly cement 5.6 13.6 2.3 -11.2***
Flooring is mainly cement or ceramic/mosaic 46.0 67.8 36.9 -30.9***
Main source of cooking fuel is wood 81.8 60.9 90.4 29.5***
Main source of lighting is electricity 12.1 25.1 6.7 -18.4***
Main drinking water source is from a protected or
safe source
1
56.9 69.6 51.7 -17.9***
No toilet system (nature) 36.5 21.1 42.9 21.8***
Observations
2
2261 707 1554
1. The safe source includes any treated water source or naturally safe such as artesian wells.
2. The number of observations of poor and non-poor is unweighted
3. Note: *** p<0.01, ** p<0.05, * p<0.1
15.
FThe
lowest consumption quintile experiences the highest levels of food insecurity,
suggesting that the poor are caught in a food security trap. If this is the case, any
intervention that helps households trapped at the bottom of the distribution
to move closer to the poverty line (while still being poor) could translate to
considerable increases in food security. Using both the objective measure
(FAO index)
17
and the self-reported measures of food security, we observe
wider gaps between households in the lowest quintile and in the 20-40 quintile
than between the other quintiles (Table 2.3). Furthermore, the share of food
insecure households decreases along the consumption quintile using either
measure (Table A8). As expected, we also find that within the food secure rural
population, non-poor households enjoy a higher food security index score
than poor households (Table 2.4)
17 Th
consumption in questionnaire into 16 food groups designated by FAO guidelines.
The 16 food groups (cereals, white roots and tubers, vitamin A rich fruit, flesh
meat etc.) are then aggregated into 12 dietary groups. Each household ends up
with a HDDS score between 0-12. The cut-off point chosen was 8 whereby a
household is considered food insecure with a HDDS score of 8 or lower.
[... middle sections omitted for long document ...]
71Rural development in Haiti: Challenges and opportunities
HH member receives income from real estate
transaction (%) 2.9 1.9 5.3
-3.3**
HH member receives other income (%) 5.9 5.1 7.8 -2.7*
85.3
Other Household Characteristics:
HH is nonpoor (%) 29.1 na na na
HH is food secure (FAO measure) (%) 64.3 55.7 85.3 -29.6***
Nonagricultural Income:
At least one HH member working in either NFE
and/or NFW 41.2 36.9 51.8
-14.9***
At least one HH member working in NFE 31.5 28.0 40.1 -12.1***
At least one HH member working in NFW 13.8 13.2 15.3 -2.1
Observations (unweighted) 2261.0 1653.0 608.0
Table A14b: Summary Statistics and test of mean differences
by poverty status- on Farm HH only
All Farm HH Poor Nonpoor Difference
Production:
Value of total harvest (HTG) 14478.0 11450.1 24038.9 -12,588.8***
Value of total harvest per ha (HTG) 108810.7 114867.4 89685.5 25,181.9
Log value of harvest per ha 8.9 8.8 9.2 -0.4**
Harvested Land Size:
Harvested hectares 1.3 1.2 1.6 -0.4**
Harvested hectares squared 4.8 3.1 10.0 -7.0
Log of Harvested Hectares -0.3 -0.4 -0.2 -0.2*
Log of Harvested Hectares squared 1.9 2.0 1.7 0.3
Physical inputs:
Fertilizer incidence of use (%) 23.2 20.0 33.3 -13.3***
Fertilizer cost per hectare (HTG) 1042.3 735.8 2010.1 -1,274.3*
Log of Fertilizer cost per hectare 1.5 1.2 2.4 -1.2***
Pesticide incidence of use (%) 22.2 21.8 23.5 -1.7
Pesticide cost per hectare (HTG) 128.6 128.4 129.3 -0.9
Log of Pesticide hectare 1.1 1.0 1.2 -0.1
Seeds incidence of use (%) 55.8 54.3 60.6 -6.3*
Seeds cost per hectare (HTG) 2743.7 2890.6 2280.0 610.6
Log of seeds cost per hectare 3.7 3.6 4.1 -0.5*
Total input cost (HTG) 4692.8 3615.7 8094.1 -4,478.4***
72Appendix
Household and NonHousehold Labor:
Number of NonHH labor used 5.7 5.1 7.7 -2.6**
Number of NonHH labor used per hectare 20.4 22.6 13.5 9.2
Log of NonHH labor per hectare 1.2 1.2 1.4 -0.2
Number of HH labor used 2.6 2.7 2.2 0.5***
Number of HH labor used per hectare 23.3 28.5 6.9 21.6***
Log of HH labor used per hectare 1.0 1.1 0.8 0.4***
Other agricultural characteristics:
HH owns livestock (%) 74.7 74.0 77.0 -2.9
HH grows a cash crop (%) 49.7 47.8 55.6 -7.8*
Number of crops grown 4.7 4.6 4.7 -0.1
HH owns plot 89.6 90.1 88.3 1.8
HH received productive input assistance(%) 1.4 1.3 1.8 -0.5
38.2 36.7 42.8 -6.1***
Socioeconomic and demographic Characteristics:
HH head is male (%) 69.6 68.2 74.0 -6.1
Age of head 51.2 50.9 52.3 -1.4
Age of head squared 2826.6 2789.5 2943.9 -154.4
Education of head (yrs) 2.0 1.6 3.3 -1.7***
Number of working age males 1.5 1.6 1.3 0.3***
Number of working age females 1.4 1.5 1.0 0.4***
Number of dependants 2.3 2.7 1.3 1.3***
HH received remittances from abroad (%) 18.1 14.6 29.2 -14.6***
HH received remittances from Haiti (%) 24.7 23.4 28.9 -5.6*
HH member receives pension (%) 0.3 0.3 0.5 -0.2
HH member receives income from real estate
transaction (%) 3.6 2.1 8.2
-6.1***
HH member receives other income (%) 5.9 4.9 9.0 -4.2*
Other Household Characteristics:
HH is nonpoor (%) 24.1 na na na
HH is food secure (FAO measure) (%) 64.6 57.3 87.8 -30.5***
Nonagricultural Income:
At least one HH member working in either NFE
and/or NFW 28.3 26.2 34.7
-8.4**
At least one HH member working in NFE 23.6 21.3 31.0 -9.7***
At least one HH member working in NFW 6.8 7.0 6.0 1.0
Observations (unweighted) 1499 1180 319
Significance denoted *** p<0.01, ** p<0.05, * p<0.1
73Rural development in Haiti: Challenges and opportunities
74
The World Bank
1818 H Street, NW,
Washington, DC 20433, USA.
www.worldbank.org