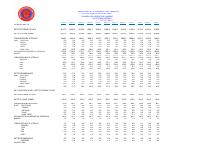
(FY2017) Public sector external debt, October 2016-September 2017 (aggregated, incl. arrears)
Summary — Monthly table from Haiti's Ministry of Economy and Finance (source: BRH) showing total public external debt from October 2016 to September 2017, broken down by bilateral and multilateral creditors, rescheduled debt, and payment arrears, in millions of US dollars and as a percent of total. Total external debt rose from USD 2,017.5 million in October 2016 to USD 2,128.8 million in September 2017.
Key Findings
- Total public external debt rose from USD 2,017.5 million (Oct-2016) to USD 2,128.8 million (Sep-2017).
- Bilateral creditors, led by Venezuela's BANDES/PetroCaribe line (USD 1,816.9 million by Sep-2017), account for about 90% of the total stock.
- Payment arrears surged from USD 6.8 million (0.3% of total) in Oct-2016 to USD 81.4 million (3.8% of total) in Sep-2017.
- Multilateral creditor exposure (FIDA, FMI, BID, OPEC) rose modestly from USD 152.1 million to USD 203.5 million over the period.
- Rescheduled debt, owed entirely to Chine Taipei, declined slightly from USD 17.0 million to USD 16.3 million.
Full Description
This one-page statistical table, issued by Haiti's Ministry of Economy and Finance (MEF) with data sourced from the Banque de la Republique d'Haiti (BRH), tracks the stock of Haiti's public sector external debt month by month from October 2016 through September 2017, in aggregated form including payment arrears. It disaggregates total long-term external debt into bilateral creditors (dominated by the Bolivarian Republic of Venezuela under the PetroCaribe/BANDES arrangement, plus Chine Taipei) and multilateral creditors (FIDA, FMI/IMF, BID/IDB, OPEC Fund; BIRD/IDA shows zero), and separately tracks rescheduled debt (Chine Taipei only) and accumulated arrears.
The series shows total external debt rising steadily from USD 2,017.5 million (October 2016) to USD 2,128.8 million (September 2017), driven mainly by continued accrual of Venezuelan (BANDES/PetroCaribe) obligations, while arrears grew sharply from USD 6.8 million to USD 81.4 million over the same period, an early signal of debt-servicing strain on the bilateral Venezuelan line. Bilateral creditors consistently account for about 90 percent of the total stock, with multilateral creditors near 9-10 percent.
Full Document Text
Extracted text from the original document for search indexing.
MINISTERE DE L'ÉCONOMIE ET DES FINANCES
Oct-16Nov-16 Dec-16 Jan-17Feb-17Mar-17Apr-17May-17Jun-17 Jul-17Aug-17Sep-17
En Millions de $ US
DETTE EXTERNE TOTALE 2017.5 2066.2 2078.42082.12089.22088.92095.72100.42105.02112.02122.92128.8
DETTE A LONG TERME 2017.5 2066.2 2078.42082.12089.22088.92095.72100.42105.02112.02122.92128.8
CREANCIERS BILATERAUX 1848.4 1853.5 1865.11868.31876.71876.11879.11883.01886.81891.71902.21909.0
DONT ETATS-UNIS 0.0 0.0 0.0 0.0 0.0 0.0 0.0 0.0 0.0 0.0 0.0 0.0
FRANCE 0.0 0.0 0.0 0.0 0.0 0.0 0.0 0.0 0.0 0.0 0.0 0.0
ESPAGNE 0.0 0.0 0.0 0.0 0.0 0.0 0.0 0.0 0.0 0.0 0.0 0.0
ITALIE 0.0 0.0 0.0 0.0 0.0 0.0 0.0 0.0 0.0 0.0 0.0 0.0
CHINE TAIPEI 66.8 66.8 66.8 66.8 66.8 66.1 66.1 66.0 65.3 65.3 65.3 65.3
REPUBLIQUE BOLIVARIENNE DU VENEZUELA 1753.4 1758.5 1770.11774.71783.11783.31786.31790.31794.81799.61810.11816.9
BANDES 28.2 28.2 28.2 26.8 26.8 26.8 26.8 26.8 26.8 26.8 26.8 26.8
1781.6 1786.7 1798.31801.51809.91810.01813.01817.01821.51826.41836.91843.7
CREANCIERS MULTILATERAUX 152.1 195.7 196.3 197.5 196.2 196.5 200.3 201.1 201.9 204.0 204.4 203.5
BIRD/IDA 0.0 0.0 0.0 0.0 0.0 0.0 0.0 0.0 0.0 0.0 0.0 0.0
FIDA 55.9 55.1 53.6 54.0 53.9 54.1 54.5 55.4 54.4 55.1 55.2 55.2
FMI 63.7 103.2 102.6 103.2 102.2 102.5 103.4 103.3 103.8 105.0 104.3 102.9
BID 0.1 0.1 0.1 0.1 0.1 0.1 0.1 0.1 0.1 0.1 0.1 0.0
OPEC 32.4 37.3 40.0 40.2 40.1 39.8 42.3 42.3 43.6 43.9 44.9 45.4
DETTE REAMENAGEE 17.0 17.0 17.0 16.3 16.3 16.3 16.3 16.3 16.3 16.3 16.3 16.3
DONT ETATS-UNIS 0.0 0.0 0.0 0.0 0.0 0.0 0.0 0.0 0.0 0.0 0.0 0.0
FRANCE 0.0 0.0 0.0 0.0 0.0 0.0 0.0 0.0 0.0 0.0 0.0 0.0
CANADA 0.0 0.0 0.0 0.0 0.0 0.0 0.0 0.0 0.0 0.0 0.0 0.0
ESPAGNE 0.0 0.0 0.0 0.0 0.0 0.0 0.0 0.0 0.0 0.0 0.0 0.0
CHINE TAIPEI 17.0 17.0 17.0 16.3 16.3 16.3 16.3 16.3 16.3 16.3 16.3 16.3
ARRIERES 6.8 11.7 18.4 22.2 28.5 37.2 43.2 51.6 58.7 64.7 74.0 81.4
EN POURCENTAGE DE LA DETTE EXTERNE TOTALE
DETTE EXTERNE TOTALE 100.0 100.0 100.0 100.0 100.0 100.0 100.0 100.0 100.0 100.0 100.0 100.0
DETTE A LONG TERME 100.0 100.0 100.0 100.0 100.0 100.0 100.0 100.0 100.0 100.0 100.0 100.0
CREANCIERS BILATERAUX 91.6 89.7 89.7 89.7 89.8 89.8 89.7 89.6 89.6 89.6 89.6 89.7
DONT ETATS-UNIS 0.0 0.0 0.0 0.0 0.0 0.0 0.0 0.0 0.0 0.0 0.0 0.0
FRANCE 0.0 0.0 0.0 0.0 0.0 0.0 0.0 0.0 0.0 0.0 0.0 0.0
ESPAGNE 0.0 0.0 0.0 0.0 0.0 0.0 0.0 0.0 0.0 0.0 0.0 0.0
ITALIE 0.0 0.0 0.0 0.0 0.0 0.0 0.0 0.0 0.0 0.0 0.0 0.0
CHINE TAIPEI 3.3 3.2 3.2 3.2 3.2 3.2 3.2 3.1 3.1 3.1 3.1 3.1
REPUBLIQUE BOLIVARIENNE DU VENEZUELA 86.9 85.1 85.2 85.2 85.3 85.4 85.2 85.2 85.3 85.2 85.3 85.3
BANDES 1.4 1.4 1.4 1.3 1.3 1.3 1.3 1.3 1.3 1.3 1.3 1.3
CREANCIERS MULTILATERAUX 7.5 9.5 9.4 9.5 9.4 9.4 9.6 9.6 9.6 9.7 9.6 9.6
BIRD/IDA 0.0 0.0 0.0 0.0 0.0 0.0 0.0 0.0 0.0 0.0 0.0 0.0
FIDA 2.8 2.7 2.6 2.6 2.6 2.6 2.6 2.6 2.6 2.6 2.6 2.6
FMI 3.2 5.0 4.9 5.0 4.9 4.9 4.9 4.9 4.9 5.0 4.9 4.8
BID 0.0 0.0 0.0 0.0 0.0 0.0 0.0 0.0 0.0 0.0 0.0 0.0
OPEC 1.6 1.8 1.9 1.9 1.9 1.9 2.0 2.0 2.1 2.1 2.1 2.1
DETTE REAMENAGEE 0.8 0.8 0.8 0.8 0.8 0.8 0.8 0.8 0.8 0.8 0.8 0.8
ARRIERES 0.3 0.6 0.9 1.1 1.4 1.8 2.1 2.5 2.8 3.1 3.5 3.8
SOURCE: BRH
DETTE EXTERNE DU SECTEUR PUBLIC
Y COMPRIS LES ARRIERES DE PAIEMENT
SOUS FORME AGREGEE
OCT 16 - Sept 17