
PRODUCTION AND TRADE FLOW MAP: HAITI LOCAL BANANA
Summary — This is a production and trade flow map for local bananas in Haiti. It shows the production status at the commune level, key market centers, and trade flows (surplus/deficit).
Key Findings
- Shows banana production status at the commune level.
- Identifies key market centers for bananas.
- Illustrates trade flows of bananas, including surplus and deficit areas.
- Highlights cross-border markets for bananas.
- Details the geography of marketing systems relevant to food security.
Full Description
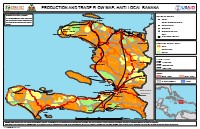
This production and trade flow map, published by FEWS NET in April 2018, illustrates the geography of marketing systems relevant to food security outcomes in Haiti, specifically focusing on local bananas. The map details production status at the commune level, indicating areas of surplus, deficit, and self-sufficiency. It also identifies key market centers and trade flows, including cross-border markets, and distinguishes between large, medium, and small trade flows. The map was created in collaboration with local government ministries, market information systems, NGOs, and private sector partners, using both qualitative and quantitative data.
Full Document Text
Extracted text from the original document for search indexing.
PRODUCTION AND TRADE FLOW MAP: HAITI LOCAL BANANA Production status is shown Key Market Centers at the Communes level and does not accurately reflect geographic ± F E Collect distribution of surplus and deficit ) ! E " Collect, Wholesale & Retail areas. ! E ( Collect & Retail " Wholesale ) " ) Wholesale and retail ( ! Retail ! & Cross Border Markets - Production Surplus / Deficit Deficit Self-Sufficient Surplus Trade Flows Large Flow Medium Flow Small Flow Roads Major roads Minor roads Arrondissements Lakes Saint Louis Port-de-Paix du Nord ! " ) F E F E Jean Rabel ! ( Môle Saint Cap Haitien ! " ) Nicolas Baie d Bombardopolis ! ( Henne e F E Limonade ! ( E Anse Rouge ! ( ! - ) Ouanaminth & " e ! ( Gonaives Hinche ( o ! Pedr Santana ! " ) & - ! ( Saint Marc Anse à Galets & - " ) Belladère ! ( " ! E ) Arcahaie ) E " ! Cabaret Jeremie ! E Croix d Port-au-Prince ( l " ) Bouque es ts ( DOMINI F E ! De mas ( ! ) " " ) REPUBL CAN IC Chambellan Léogane ! Carrefour " ) ! ! P ! étion Ville & - ! ( Malpasse F E Grand Goave Les Anglais Cayes Jacmel Marigot F E Jacmel ! F E ! ( Bainet " F E ) F E Cayes Anse à Pitres - & ( ! 0 25 50 100 Kilometers FEWS NET Production and Trade Flow Maps provide a summary of the geography of marketing systems that are relevant to food security outcomes during an average marketing year or season. The maps are produced by FEWS NET in collaboration with stakeholders from local government ministries, market information systems, NGOs, and private sector partners, using a mix of qualitative and quantitative data. Published April 2018