
Haïti Participation Économique des Femmes - Aperçu de l'Économie
Resume — Cet aperçu économique de la Banque mondiale analyse la participation économique des femmes en Haïti à travers plusieurs dimensions incluant la participation à la main-d'œuvre, l'inclusion financière, les cadres juridiques et les normes sociales. Le document présente des données comparatives montrant les performances d'Haïti par rapport aux moyennes mondiales, régionales et par groupe de revenu.
Constats Cles
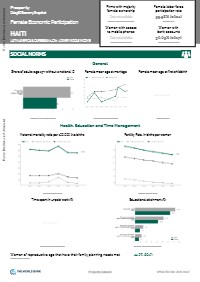
- Le taux de participation des femmes à la main-d'œuvre en Haïti est de 59,98%, supérieur à la moyenne mondiale de 51,1%.
- Seulement 30,05% des femmes ont des comptes bancaires, indiquant une faible inclusion financière.
- Les femmes font face à des restrictions légales dans la propriété immobilière et les demandes de passeport.
- Les écarts éducatifs entre les sexes persistent avec seulement 9,2% des femmes terminant l'enseignement secondaire contre 15,0% des hommes.
- Le taux d'emploi informel pour les femmes atteint 93,8%, limitant l'accès aux opportunités économiques formelles.
Description Complete
Cet aperçu économique complet de Prosperity Data360 de la Banque mondiale examine la participation économique des femmes en Haïti à travers plusieurs prismes analytiques. Le document couvre la participation à la main-d'œuvre, Haïti affichant un taux de participation des femmes de 59,98% en 2024, significativement plus élevé que de nombreux homologues régionaux. Cependant, le pays fait face à des défis importants en matière d'inclusion financière, avec seulement 30,05% des femmes ayant des comptes bancaires en 2017.
L'analyse révèle des lacunes substantielles dans le cadre juridique et réglementaire d'Haïti pour l'égalité des sexes. Bien que les femmes puissent exercer de nombreuses activités économiques sur un pied d'égalité avec les hommes, des restrictions critiques demeurent, particulièrement dans les droits de propriété immobilière et les demandes de passeport. Le score de l'Indice des Institutions Sociales et du Genre (SIGI) de 46,4 indique une discrimination modérée contre les femmes dans les institutions sociales, considérablement plus élevé que les moyennes régionale (21,2) et mondiale (28,99).
Les données sur le niveau d'éducation montrent des écarts persistants entre les sexes, avec des taux d'alphabétisation masculine à 72,9% comparé à 63,9% pour les femmes en 2017. Les taux d'achèvement de l'enseignement secondaire montrent des différences encore plus marquées, avec seulement 9,2% des femmes de 25 ans et plus terminant l'enseignement secondaire contre 15,0% des hommes. Ces disparités éducatives ont des implications à long terme pour la participation économique des femmes et leurs opportunités d'avancement.
Le document souligne également les domaines où les données restent indisponibles, particulièrement concernant la propriété d'entreprises, l'entrepreneuriat et l'accès à la technologie. Le taux d'emploi informel pour les femmes atteint 93,8%, indiquant que la grande majorité des femmes économiquement actives opèrent en dehors des structures économiques formelles, limitant leur accès à la protection sociale et aux opportunités de croissance.
Texte Integral du Document
Texte extrait du document original pour l'indexation.
Public Disclosure Authorized Public Disclosure Authorized Prosperity Data360 Economy Snapshot Female Economic Participation HAITI LATIN AMERICA & CARIBBEAN (LCN) ; LOWER MIDDLE INCOME SOCIAL NORMS Firms with majority female ownership Data not available SOURCE: ENTERPRISE SURVEYS Women with access to mobile phones Data not available SOURCE: GLOBAL FINDEX General Female labor force participation rate 59.98% (2024) SOURCE: WDI Women with bank accounts 30.05% (2017) SOURCE: GLOBAL FINDEX Share of adults (age 15+) without a national ID Female mean age at marriage Female mean age at first childbirth SOURCE: ID4D FINDEX SURVEY SOURCE: GENDER STATISTICS SOURCE: OECD Public Disclosure Authorized Health, Education and Time Management Maternal mortality ratio per 100,000 live births Fertility Rate, in births per woman Public Disclosure Authorized SOURCE: WORLD BANK SOURCE: WORLD BANK Time spent in unpaid work (%) Educational attainment (%) SOURCE: GENDER STATISTICS SOURCE: EDUCATION STATISTICS Women of reproductive age that have their family planning needs met 44.0% (2017) SOURCE: WORLD BANK Prosperity Data360 UPDATED ON: 2025-10-07 Gender-Based Violence Mobility Can a woman choose where to live in the same way as a man? No Can a woman travel outside her home in the same way as a man? Yes Can a woman apply for a passport in the same way as a man? No SOURCE: WHO SOURCE: WOMEN, BUSINESS & THE LAW Voice & Agency Women in Ministerial Level Positions (Rank) NA SOURCE: WEF GLOBAL GENDER GAP REPORT Political participation score of the country 2.5/10 (2024) SOURCE: BTI Social Institutions Gender Index (SIGI)* SIGI Regional Average SIGI Global Average 46.4 (2023) 21.2 (2023) 28.99 (2023) *SIGI measures discrimination against women in social institutions (0 = no discrimination; 100 = absolute discrimination). SOURCE: GENDER INDEX BUSINESS CLIMATE Labor Force Labor force participation rate (%) Informal employment (%) SOURCE: WBG - WDI SOURCE: ILOSTAT Employment, by type (%) Employment, by sector (%) SOURCE: WBG - WDI SOURCE: WBG - WDI Prosperity Data360 UPDATED ON: 2025-10-07 Wage equality between women and men for similar work (survey data, normalized on a 0-to-1 scale)* NA *This indicator is derived from the following survey question: In your country, for similar work, to what extent are wages for women equal to those of men? 1 = not at all/significantly below those of men. 7 = fully/equal to those of men. It is then transformed into a 0-1 scale where zero means “large gap” and 1 means “no gap”. Country Economic Participation and Opportunity Index (Score 0-1) NA SOURCE: WEF GLOBAL GENDER GAP REPORT Business Climate Starting a business Proprietors & Directors (%) SOURCE: DOING BUSINESS SOURCE: GENDER STATISTICS Percentage of firms with majority female ownership NA SOURCE: WBG ENTERPRISE SURVEYS Firms with female top manager NA SOURCE: ILO Firms identifying access to finance as a major constraint NA SOURCE: WBG ENTERPRISE SURVEYS Perceived ease of doing business index 179/190 (2019) SOURCE: DOING BUSINESS Perceived attitude toward entrepreneurial failure * 2.77/7 (2019) SOURCE: WEF GCI Equal access to property rights index (-2-0) ** -1 (2019) SOURCE: DOING BUSINESS *Scores (1-7): 1 - No appetite for entrepreneurial risk; 7 - greater appetite for risk ** The equal access to property rights index evaluates whether married or unmarried women have equal access to property rights. It has two components: (i) whether unmarried men and unmarried women have equal ownership rights to property; and (ii) whether married men and married women have equal ownership rights to property. The index is computed based on the methodology in the DB17-20 studies. TEA SOURCE: GEM TEA: Category description: 1. TEA of working age population - Percentage of 18-64 population who are either a nascent entrepreneur or owner-manager of a new business 2. TEA Nascent entrepreneurs - Female/Male TEA: percentage of females (ages 18-64) who are either a nascent entrepreneur or owner-manager of a new business, divided by the equivalent percentage of their male counterparts 3. TEA driven by opportunity - Percentage of those females involved in TEA who (i) claim to be driven by opportunity as opposed to finding no other option for work; and (ii) who indicate the main driver for being involved in this opportunity is being independent or increasing their income, rather than just maintaining their income, divided by the equivalent percentage for their male counterparts Prosperity Data360 UPDATED ON: 2025-10-07 TECHNOLOGY Social Norms Banking and Technology Mobile Phone and Internet Access Mobile money services SOURCE: GLOBAL FINDEX SOURCE: GLOBAL FINDEX Mobile Connectivity Index Made or received digital payments - female (age 15+) 47.0/100 (2024) The GSMA Mobile Connectivity Index measures the performance of 170 countries – representing 99% of the global population – against key enablers of mobile internet adoption: infrastructure, affordability, consumer readiness, and content and services. SOURCE: GSMA SOURCE: GLOBAL FINDEX Innovation and Technology in Accessing Markets Percentage of firms with their own websites NA SOURCE: ENTERPRISE SURVEYS Can a broadband connection request be completed entirely online? NA Average price for a month of business broadband connection with NA at least 10 Mbps download speed with unlimited data usage SOURCE: DIGITAL BUSINESS INDICATORS LEGAL AND REGULATORY FRAMEWORK Family law Can a woman be head of household in the same way as a man? Yes There is no legal provision that requires a married woman to obey her husband Yes Do married couples jointly share legal responsibility for financially maintaining the family's expenses? Yes SOURCE: WOMEN, BUSINESS AND THE LAW Prosperity Data360 UPDATED ON: 2025-10-07 First married by age 18 (% of women aged 20-24) Credit and Finance Laws Can a woman legally open a bank account Yes in the same way as a man? Can a woman sign a contract in the same Yes way as a man? Can a woman register a business in the Yes same way as a man? The law prohibits discrimination in access to No credit based on gender SOURCE: WORLD BANK - WDI SOURCE: WOMEN, BUSINESS AND THE LAW Legal Right to Assets Do men and women have equal ownership rights to immovable property? No Do sons and daughters have equal rights to inherit assets from their parents? Yes Do female and male surviving spouses have equal rights to inherit assets? Yes Does the law grant spouses equal administrative authority over assets during marriage? No Does a woman's testimony carry the same evidentiary weight in court as a man's? Yes Does the law provide for the valuation of nonmonetary contributions (i.e.; unpaid domestic work)? Yes SOURCE: WOMEN, BUSINESS AND THE LAW Workplace Can a woman get a job in the same way as a man? Yes Can women work in jobs deemed dangerous in the same way as men? Yes Law prohibits discrimination in employment based on gender Yes Is there legislation on sexual harassment in employment? No Does the government support or provide childcare services? No Are there criminal penalties or civil remedies for sexual harassment in employment? No SOURCE: WOMEN, BUSINESS AND THE LAW Pay Does the law mandate equal remuneration for work of equal value? Yes Are women able to work in the same industries as men? Yes Are childcare payments tax-deductible? No SOURCE: WOMEN, BUSINESS AND THE LAW Prosperity Data360 UPDATED ON: 2025-10-07 ACCESS TO FINANCE Bank Accounts Savings SOURCE: GLOBAL FINDEX SOURCE: GLOBAL FINDEX Credit SOURCE: GLOBAL FINDEX ACCESS TO MARKETS Days to obtain an import license NA Percentage of firms expected to give gifts to public officials to get things done NA Percentage of firms identifying customs and trade restrictions as major constraint NA Percentage of firms whose new products/services are also new to the main market NA Does the country's infrastructure, roads, utilities, communications, waste disposal NA provide support for new and growing firms? SOURCE: ENTERPRISE SURVEYS TRAINING SKILLS AND INFORMATION Percentage of country's labor force with business skills NA (accounting, communications, finance, management, marketing, sales) SOURCE: GLOBAL SKILLS INDEX Presence and quality of programs directly assisting SMEs NA at all levels of government (national, regional, municipal) SOURCE: GEM Click to view comparative global, regional, and income-group data, starting on Page 9. The data for this economy snapshot were curated by Noa Gimelli, Anja Robakowski and Linda Scott. For feedback and/or comments please click here. Prosperity Data360 UPDATED ON: 2025-10-07 Disclaimer The Prosperity Data360 platform only aggregates publicly available data and does not produce or own any mentioned data. The World Bank’s Doing Business (DB) report was discontinued on September 16th, 2021 due to data irregularities. Data rectification of affected historical DB data (2016-2020) was carried out. This historical data, including the sets incorporated in these sheets, may be used for research and analysis. Region and income group mapping followed in the data sheets are as per the official World Bank classification. Aggregates calculated do not include economies absent in the World Bank list. Economy borders or names do not necessarily reflect the World Bank Group's official position. Maps available through the Prosperity Data360 are for illustrative purposes and do not imply the expression of any opinion on the part of the World Bank, concerning the legal status of any economy or territory or concerning the delimitation of frontiers or boundaries. For specific comments, please use the feedback link at the bottom of the previous page. Prosperity Data360 UPDATED ON: 2025-10-07 Appendix Comparison with Global, Regional and Income Group Averages Abbreviations Abbreviation Description EAS East Asia & Pacific ECS Europe & Central Asia LCN Latin America & Caribbean MEA Middle East & North Africa NAC North America SAS South Asia SSF Sub-Saharan Africa LIC Low income LMC Lower middle income UMC Upper middle income HIC High income Prosperity Data360 UPDATED ON: 2025-10-07 Global, Regional & Income Group Average Comparison SOCIAL NORMS Regional Averages Income Group Averages Indicator Year HTI Global EAS ECS LCN MEA NAC SAS SSF LIC LMC UMC HIC Share of men (age 15+) without a national ID (%) Share of women (age 15+) without a national ID (%) 2017 24.0 11.6 10.5 4.4 4.6 6.2 - 7.7 27.0 32.5 15.1 4.7 3.4 2017 17.0 15.2 11.0 3.8 4.6 18.3 - 10.7 35.6 51.5 17.7 4.9 3.1 Female mean age at marriage 2016 24.9 26.8 25.2 31.1 23.3 25.5 29.6 21.8 23.0 21.1 23.0 23.8 30.6 Mean age of woman at birth of first child 2021 - 29.5 31.1 29.5 - 28.7 27.3 - - - - - 29.5 Maternal mortality ratio per 100,000 live births 2023 328.0 116.1 88.2 9.1 69.9 62.0 14.5 72.3 315.8 364.2 174.0 58.1 19.1 Total Fertility Rate 2023 2.7 2.4 2.2 1.6 1.8 2.5 1.4 1.9 4.0 4.4 3.1 2.0 1.6 Time spent in unpaid work, females (%) 2023 - 17.8 19.1 - - - 16.5 - - - - 19.1 16.5 Time spent in unpaid work, males (%) 2023 - 10.4 9.2 - - - 11.6 - - - - 9.2 11.6 Literacy rate, adult male (% of males ages 15 and above) Literacy rate, adult female (% of females ages 15 and above) Population age 25+ with primary schooling, Male (%) Population age 25+ with primary schooling, Female (%) Population age 25+ with secondary schooling, Male (%) Population age 25+ with secondary schooling, Female (%) Population age 25+ with tertiary schooling, Male (%) Population age 25+ with tertiary schooling, Female (%) Women of reproductive age that have their family planning needs met (%) 2017 72.9 86.0 91.1 99.3 92.9 89.7 - 84.5 67.2 66.6 75.7 95.5 96.9 2017 63.9 78.5 83.9 97.6 90.7 81.0 - 78.2 48.5 45.3 64.1 93.1 95.2 2017 51.7 83.7 86.6 98.5 78.7 74.1 96.3 63.2 64.8 57.0 70.5 83.5 95.6 2017 42.0 78.7 81.6 96.9 76.6 65.6 96.1 53.2 52.4 41.3 59.5 80.6 94.4 2017 15.0 53.6 54.0 77.6 40.5 43.3 87.7 33.6 24.5 22.4 34.6 53.6 69.9 2017 9.2 50.0 51.4 72.6 41.6 41.3 88.6 27.3 16.6 13.1 28.6 51.0 68.0 2012 12.0 20.1 25.9 25.1 13.4 21.2 49.6 9.1 7.4 14.3 10.9 15.8 26.8 2012 7.0 19.8 23.0 26.1 14.8 19.5 50.0 4.1 4.0 8.7 7.5 15.2 28.4 2017 44.0 50.3 67.0 52.1 44.0 - - 29.8 46.2 39.4 51.5 53.4 - Lifetime intimate partner violence (%) 2018 23.0 26.3 31.0 18.6 24.5 28.5 26.0 29.5 32.6 34.5 30.7 25.0 20.6 Intimate partner violence within last year (%) Can a woman choose where to live in the same way as a man? Can a woman travel outside her home in the same way as a man? 2018 12.0 11.6 14.7 5.3 8.1 14.1 4.5 11.8 18.9 20.4 16.1 10.1 5.3 2023 0.0 0.8 0.9 1.0 0.9 0.5 1.0 0.8 0.7 0.5 0.8 0.9 0.9 2023 1.0 0.9 0.9 1.0 1.0 0.5 1.0 1.0 1.0 0.9 0.9 0.9 0.9 Prosperity Data360 UPDATED ON: 2025-10-07 Global, Regional & Income Group Average Comparison SOCIAL NORMS Regional Averages Income Group Averages Indicator Year HTI Global EAS ECS LCN MEA NAC SAS SSF LIC LMC UMC HIC Can a woman apply for a passport in the same way as a man? Women In Ministerial Level Positions (Rank) 2023 0.0 0.9 0.8 1.0 0.8 0.7 1.0 1.0 0.8 0.9 0.8 0.8 0.9 2022 - 72.6 102.1 60.3 55.3 98.1 56.5 114.1 63.5 63.8 89.1 69.9 63.1 Political Participation Ranking 2024 2.5 5.1 4.5 6.3 6.8 2.6 - 5.9 4.6 3.5 4.4 5.6 6.8 Social Institutions Gender Index (SIGI) 2023 46.4 29.0 29.1 16.1 21.2 52.3 18.3 41.8 39.0 41.1 39.7 25.0 18.1 BUSINESS CLIMATE Regional Averages Income Group Averages Indicator Year HTI Global EAS ECS LCN MEA NAC SAS SSF LIC LMC UMC HIC Male labor force participation rate (%) 2024 70.6 69.7 71.5 66.1 72.6 72.3 68.5 71.7 68.9 71.4 69.1 70.2 69.1 Female labor force participation rate (%) 2024 60.0 51.1 56.1 53.4 51.6 28.8 58.8 38.9 56.8 54.3 48.8 48.2 53.9 Informal employment, male (% of total non-agricultural employment) Informal employment, female (% of total non-agricultural employment) Part-time employment, female (% of total female employment) Part-time employment, male (% of total male employment) Female permanent full-time workers (% of total full-time workers) Male permanent full-time workers (% of total full-time workers) Percentage of the population that is self-employed Employment in industry, male (% of male employment) Employment in industry, female (% of female employment) Employment in services, male (% of male employment) Employment in services, female (% of female employment) 2012 81.8 30.5 46.6 8.1 54.4 33.1 - 76.4 65.9 79.7 67.7 40.8 7.6 2012 93.8 31.5 47.3 7.0 60.0 21.8 - 76.2 71.6 87.8 67.2 40.9 8.8 2012 30.0 36.3 30.5 35.3 35.8 46.8 43.3 25.8 41.9 51.7 35.9 31.5 38.7 2012 28.6 22.3 21.5 20.9 21.5 19.3 26.6 15.9 32.2 41.2 24.1 19.3 22.3 2020 - 32.0 - 34.5 - 28.4 - - - - 28.4 48.1 27.6 2020 - 68.0 - 65.5 - 71.6 - - - - 71.6 51.9 72.4 2023 75.4 39.8 39.5 21.2 35.2 26.3 9.6 57.4 67.9 75.9 57.7 36.6 14.4 2023 14.0 25.3 24.0 32.2 25.7 28.3 28.5 23.6 17.2 14.7 21.7 27.4 30.7 2023 10.6 11.8 12.2 12.7 10.5 12.4 8.6 17.8 10.3 9.7 12.7 13.7 10.5 2023 30.7 52.1 53.0 56.9 56.3 60.5 69.6 44.9 39.8 36.5 44.7 51.2 64.5 2023 57.6 66.8 67.9 75.9 82.1 74.7 90.4 37.4 45.4 34.8 53.0 69.5 87.3 Prosperity Data360 UPDATED ON: 2025-10-07 Global, Regional & Income Group Average Comparison BUSINESS CLIMATE Regional Averages Income Group Averages Indicator Year HTI Global EAS ECS LCN MEA NAC SAS SSF LIC LMC UMC HIC Employment in agriculture, male (% of male employment) Employment in agriculture, female (% of female employment) Wage equality between women and men for similar work (0-to-1 scale) Country Economic Participation and Opportunity Index (0-to-1 scale) 2023 55.3 22.6 23.0 11.0 18.0 11.2 1.9 31.6 42.9 48.7 33.6 21.4 4.8 2023 31.8 21.4 19.9 11.4 7.4 13.0 0.9 44.8 44.3 55.5 34.3 16.7 2.2 2022 - 0.7 0.7 0.7 0.6 0.7 0.7 0.6 0.7 0.7 0.7 0.6 0.7 2022 - 0.7 0.7 0.7 0.7 0.5 0.7 0.4 0.7 0.7 0.6 0.7 0.7 Time in days to start a business, male 2019 97.0 19.6 23.3 11.8 28.1 18.7 2.8 15.2 21.5 21.9 24.8 19.1 11.5 Time in days to start a business, female 2019 97.0 19.7 23.4 11.8 28.1 19.3 2.8 15.2 21.6 22.1 24.9 19.2 11.6 Cost as a % of income per capita to start a business, male Cost as a % of income per capita to start a business, female Number of procedures to start a business, male Number of procedures to start a business, female 2019 179.7 19.9 16.3 3.3 30.6 15.2 0.6 8.8 36.3 48.8 28.1 13.2 4.3 2019 179.7 19.9 16.3 3.3 30.6 15.2 0.6 8.8 36.3 48.8 28.1 13.2 4.3 2019 12.0 6.6 6.3 5.3 8.0 6.1 4.0 8.0 7.4 6.9 7.3 7.0 5.4 2019 12.0 6.7 6.3 5.3 8.0 6.7 4.0 8.0 7.5 7.1 7.4 7.1 5.5 Share of male sole proprietors 2022 - 61.9 54.6 63.4 51.5 76.5 - - 63.3 59.0 62.4 60.8 62.5 Share of female sole proprietors 2022 - 38.1 45.4 36.6 48.5 23.5 - - 36.7 41.0 37.6 39.2 37.5 Share of male directors 2022 - 75.4 69.1 76.6 66.3 86.6 - 72.9 73.3 79.4 78.9 73.5 74.5 Share of female directors 2022 - 24.6 30.9 23.4 33.7 13.4 - 27.1 26.7 20.6 21.1 26.5 25.5 Firms with majority female ownership (%) 2020 - 9.6 - 12.7 - 5.0 - - - - 5.0 18.1 10.0 Firms with female top manager (%) 2024 - 18.8 32.1 16.2 26.0 7.9 22.1 21.4 18.6 13.6 19.7 21.0 17.6 Firms identifying access to finance as a major constraint (%) Perceived ease of doing business index (Rank) Perceived attitude toward entrepreneurial failure (Score 1-7) Equal access to property rights index (-2-0) 2020 - 23.9 - 18.0 - 32.8 - - - - 32.8 31.6 11.2 2019 179.0 95.9 87.0 42.6 114.3 106.6 14.5 109.8 139.5 156.0 124.5 90.8 51.3 2019 2.8 4.0 4.3 4.1 3.9 4.2 5.1 4.0 3.8 3.6 3.9 4.0 4.2 2019 -1.0 -0.1 -0.2 0.0 -0.1 0.0 0.0 0.0 -0.2 -0.1 -0.1 -0.1 -0.0 TEA of working age population 2024 - 13.2 10.6 10.6 20.5 13.0 22.3 12.2 - - 12.8 17.8 11.4 TEA Nascent entrepreneurs 2024 - 0.8 0.9 0.7 0.9 0.8 0.8 0.7 - - 0.7 0.9 0.7 TEA driven by opportunity 2023 - - - - - - - - - - - - - Prosperity Data360 UPDATED ON: 2025-10-07 Global, Regional & Income Group Average Comparison TECHNOLOGY Regional Averages Income Group Averages Indicator Year HTI Global EAS ECS LCN MEA NAC SAS SSF LIC LMC UMC HIC Mobile phone ownership - male (%) 2022 - 85.0 - 97.1 59.4 98.6 - - - - 98.6 78.2 - Mobile phone ownership - female (%) 2022 - 82.1 - 91.6 58.3 96.2 - - - - 96.2 75.0 - Internet use, male (%) 2024 - 92.6 - 95.9 76.2 - - - - - - 76.2 95.9 Internet use, female (%) 2024 - 92.6 - 95.5 78.2 - - - - - - 78.2 95.5 Used a mobile phone or the internet to pay bills, female (% age 15+) Used a mobile phone or the internet to pay bills, male (% age 15+) Used a mobile phone or the internet to buy something online, female (% age 15+) Used a mobile phone or the internet to buy something online, male (% age 15+) Mobile Connectivity Index Score (Score 1-100) 2024 - 26.1 34.2 31.7 25.1 23.5 - 8.8 19.3 13.5 19.5 28.8 36.3 2024 - 31.7 33.1 36.7 30.8 34.3 - 18.4 26.3 22.9 25.0 33.7 42.4 2024 - 26.4 42.4 29.5 17.6 21.8 - 11.4 15.2 - 19.3 25.6 38.4 2024 - 28.6 37.7 30.1 23.0 26.0 - 20.9 18.7 - 20.4 28.1 37.0 2024 47.0 65.9 71.4 82.3 66.9 67.5 89.8 61.9 44.5 34.7 54.7 68.7 85.1 Mobile money account, male (% age 15+) 2017 15.9 29.1 17.7 18.5 20.6 26.6 - 30.2 32.3 27.6 34.7 28.3 22.0 Mobile money account, female (% age 15+) 2017 11.3 22.2 15.0 14.3 15.6 20.1 - 14.7 25.3 18.9 27.3 23.4 17.2 Made or received digital payments in the past year, female (% age 15+) 2017 25.4 50.4 64.2 71.2 38.8 43.8 94.0 24.5 31.0 20.3 27.1 46.5 82.6 Firms with their own websites (%) 2020 - 67.1 - 78.9 - 49.4 - - - - 49.4 57.5 89.6 Can a broadband connection request be completed entirely online? Average monthly price for business broadband connection (USD) 2019 - 0.0 0.0 0.0 0.0 0.0 - 0.0 0.0 0.0 0.0 0.0 0.0 2019 - 252.8 32.2 54.1 124.2 163.8 - 182.0 925.0 2500.0 217.0 31.5 139.7 LEGAL AND REGULATORY FRAMEWORK Regional Averages Income Group Averages Indicator Year HTI Global EAS ECS LCN MEA NAC SAS SSF LIC LMC UMC HIC Can a woman be head of household in the same way as a man? There is no legal provision that requires a married woman to obey her husband (1=yes; 0=no) 2023 1.0 0.9 0.9 1.0 1.0 0.6 1.0 1.0 0.7 0.5 0.8 0.9 1.0 2023 1.0 0.9 0.9 1.0 1.0 0.5 1.0 1.0 0.9 0.8 0.9 0.9 0.9 Prosperity Data360 UPDATED ON: 2025-10-07 Global, Regional & Income Group Average Comparison LEGAL AND REGULATORY FRAMEWORK Regional Averages Income Group Averages Indicator Year HTI Global EAS ECS LCN MEA NAC SAS SSF LIC LMC UMC HIC Do married couples jointly share legal responsibility for financially maintaining the family's expenses? Women who were first married by age 18 (% of women ages 20-24) Can a woman legally open a bank account in the same way as a man? Can a woman sign a contract in the same way as a man? Can a woman register a business in the same way as a man? The law prohibits discrimination in access to credit based on gender (1=yes; 0=no) Do men and women have equal ownership rights to immovable property? Do sons and daughters have equal rights to inherit assets from their parents? Do female and male surviving spouses have equal rights to inherit assets? Does the law grant spouses equal administrative authority over assets during marriage? Does a woman's testimony carry the same evidentiary weight in court as a man's? Does the law provide for the valuation of nonmonetary contributions (i.e.; unpaid domestic work)? Can a woman get a job in the same way as a man? Can women work in jobs deemed dangerous in the same way as men? Law prohibits discrimination in employment based on gender (1=yes; 0=no) Is there legislation on sexual harassment in employment? 2018 1.0 0.8 0.9 1.0 1.0 0.3 1.0 0.5 0.9 0.8 0.8 0.9 0.9 2017 14.9 14.2 16.4 5.0 14.9 - - 2.2 24.2 14.6 20.3 9.2 3.2 2023 1.0 1.0 1.0 1.0 1.0 1.0 1.0 1.0 0.9 0.9 1.0 1.0 1.0 2023 1.0 1.0 1.0 1.0 1.0 1.0 1.0 1.0 1.0 1.0 1.0 1.0 1.0 2023 1.0 1.0 1.0 1.0 1.0 1.0 1.0 1.0 0.9 1.0 1.0 1.0 1.0 2023 0.0 0.5 0.4 0.8 0.3 0.4 1.0 0.2 0.4 0.2 0.4 0.5 0.7 2023 0.0 0.9 0.7 1.0 0.9 1.0 1.0 1.0 0.8 0.8 0.8 0.9 1.0 2023 1.0 0.8 0.8 1.0 1.0 0.1 1.0 0.7 0.8 0.6 0.7 0.8 0.9 2023 1.0 0.8 0.8 1.0 1.0 0.1 1.0 0.7 0.7 0.6 0.7 0.8 0.9 2023 0.0 0.9 0.8 1.0 0.9 1.0 1.0 1.0 0.8 0.8 0.8 0.9 1.0 2018 1.0 0.9 1.0 1.0 1.0 0.4 1.0 1.0 1.0 0.9 0.9 0.9 0.9 2023 1.0 0.7 0.7 1.0 0.9 0.1 1.0 0.0 0.6 0.5 0.5 0.8 0.8 2023 1.0 0.9 1.0 1.0 1.0 0.6 1.0 1.0 0.8 0.7 0.9 1.0 1.0 2023 1.0 0.8 0.9 0.9 0.9 0.4 1.0 0.8 0.6 0.5 0.7 0.8 0.9 2023 1.0 0.9 0.7 1.0 0.8 0.7 1.0 0.7 0.9 0.9 0.8 0.8 0.9 2023 0.0 0.8 0.6 0.9 0.8 0.7 1.0 1.0 0.8 0.7 0.8 0.8 0.8 Prosperity Data360 UPDATED ON: 2025-10-07 Global, Regional & Income Group Average Comparison LEGAL AND REGULATORY FRAMEWORK Regional Averages Income Group Averages Indicator Year HTI Global EAS ECS LCN MEA NAC SAS SSF LIC LMC UMC HIC Does the government support or provide childcare services? Are there criminal penalties or civil remedies for sexual harassment in employment? Does the law mandate equal remuneration for work of equal value? Are women able to work in the same industries as men? 2018 0.0 0.7 0.5 1.0 0.8 0.7 1.0 0.0 0.5 0.4 0.5 0.8 0.9 2023 0.0 0.7 0.5 0.8 0.7 0.7 1.0 0.8 0.8 0.7 0.7 0.7 0.8 2023 1.0 0.5 0.3 0.8 0.3 0.5 0.5 0.3 0.5 0.5 0.4 0.5 0.6 2023 1.0 0.7 0.7 0.8 0.7 0.5 1.0 0.5 0.6 0.6 0.5 0.7 0.8 Are childcare payments tax-deductible? 2018 0.0 0.2 0.1 0.3 0.3 0.0 1.0 0.2 0.0 0.0 0.0 0.2 0.3 ACCESS TO FINANCE Regional Averages Income Group Averages Indicator Year HTI Global EAS ECS LCN MEA NAC SAS SSF LIC LMC UMC HIC Account ownership at a financial institution or with a mobile-money-service provider, male Account ownership at a financial institution or with a mobile-money-service provider, female Financial institution account, male (% age 15+) Financial institution account, female(% age 15+) 2017 35.4 64.5 69.7 78.8 56.5 61.8 96.6 71.4 46.2 35.9 46.8 62.3 90.2 2017 30.0 57.6 69.7 75.7 48.3 46.4 96.3 60.3 36.2 24.4 37.0 55.7 86.9 2017 29.3 62.9 70.7 78.7 54.2 67.1 96.6 56.2 37.4 29.7 39.4 61.2 90.5 2017 27.1 56.5 70.5 75.6 46.6 53.4 96.3 44.4 28.2 19.4 30.3 54.8 87.5 Debit card ownership, male (% age 15+) 2017 13.0 53.7 64.1 67.4 38.8 53.8 88.8 51.2 28.7 18.7 25.7 46.1 80.2 Debit card ownership, female (% age 15+) 2017 8.8 47.4 64.3 63.8 30.0 41.2 88.2 39.6 20.1 10.8 17.4 38.4 77.1 Saved at a financial institution, male (% age 15+) Saved at a financial institution, female (% age 15+) Saved to start, operate, or expand a farm or business, male (% age 15+) 2017 11.1 31.8 42.4 39.2 20.0 28.9 66.8 25.5 20.8 17.5 18.7 22.1 46.5 2017 13.2 27.4 41.9 35.8 14.3 20.8 63.2 23.2 15.1 12.2 14.9 18.2 42.3 2017 12.3 16.9 19.8 12.3 18.4 15.6 17.8 12.7 21.9 20.1 18.4 15.6 15.2 Prosperity Data360 UPDATED ON: 2025-10-07 Global, Regional & Income Group Average Comparison ACCESS TO FINANCE Regional Averages Income Group Averages Indicator Year HTI Global EAS ECS LCN MEA NAC SAS SSF LIC LMC UMC HIC Saved to start, operate, or expand a farm or business, female (% age 15+) 2017 12.0 11.7 14.3 7.7 12.5 7.6 9.2 9.7 17.6 16.4 13.9 10.0 9.4 Credit card ownership, male (% age 15+) 2024 - 25.1 31.0 26.1 21.9 18.2 - - 24.1 - 13.2 24.9 22.9 Credit card ownership, female (% age 15+) Borrowed from a financial institution, male (% age 15+) Borrowed from a financial institution, female (% age 15+) Borrowed from family or friends, male (% age 15+) Borrowed from family or friends, female (% age 15+) Borrowed from a savings club, male (% age 15+) Borrowed from a savings club, female (% age 15+) 2024 - 19.4 28.1 20.4 15.8 13.6 - - 13.4 - 9.6 18.4 20.0 2017 12.2 31.6 37.1 35.8 23.2 36.8 76.5 18.5 17.2 13.7 17.3 23.6 45.4 2017 13.4 26.9 38.0 30.2 18.4 28.2 74.8 15.5 11.4 10.6 14.4 18.8 40.2 2017 24.7 25.9 26.6 20.7 17.2 31.2 13.7 30.5 32.4 32.3 28.6 27.6 17.3 2017 18.2 23.6 25.5 19.9 15.2 30.0 15.5 24.9 28.1 27.4 25.9 25.1 17.1 2024 - 12.3 - 4.9 - - - - 12.9 16.9 9.2 - - 2024 - 17.6 - 15.0 - - - - 18.2 20.2 16.5 - - Male landholders (%) 2017 20.7 20.8 - - 20.7 - - - 20.9 21.9 20.3 - - Female landholders (%) 2017 6.9 5.9 7.7 - 6.9 - - - 3.6 4.7 4.1 12.7 - ACCESS TO MARKETS Regional Averages Income Group Averages Indicator Year HTI Global EAS ECS LCN MEA NAC SAS SSF LIC LMC UMC HIC Days to obtain an import license 2020 - 28.6 - 29.7 - 27.6 - - - - 27.6 12.0 47.4 Firms expected to give gifts to public officials to get things done (%) Firms identifying customs and trade restrictions as major constraint (%) Firms whose new products/services are also new to the main market (%) Does the country's infrastructure, roads, utilities, communications, waste disposal provide support for new and growing firms? 2020 - 2.1 - 0.8 - 3.9 - - - - 3.9 1.1 0.7 2020 - 12.5 - 4.8 - 24.1 - - - - 24.1 6.1 4.2 2020 - 73.3 - 67.9 - 81.5 - - - - 81.5 74.8 64.4 2024 - 6.5 7.3 6.3 5.9 7.1 6.7 7.0 4.8 - 6.7 6.1 6.6 Prosperity Data360 UPDATED ON: 2025-10-07 Global, Regional & Income Group Average Comparison TRAINING SKILLS AND INFORMATION Regional Averages Income Group Averages Indicator Year HTI Global EAS ECS LCN MEA NAC SAS SSF LIC LMC UMC HIC Country's labor force with business skills (%) Presence and quality of programs directly assisting SMEs at all levels of government 2025 - 50.5 62.7 72.4 33.1 37.5 86.5 19.6 24.9 16.0 23.5 39.5 74.8 2024 - 4.6 5.4 4.6 3.8 5.2 4.3 6.3 3.3 - 4.7 3.8 5.0 Prosperity Data360 UPDATED ON: 2025-10-07