
Aperçu de l'économie touristique d'Haïti - Prosperity Data360
Resume — Cet aperçu des données touristiques de la Banque mondiale présente les principaux indicateurs touristiques pour Haïti, montrant la contribution du tourisme au PIB à 4,1% et à l'emploi à 12,3% en 2024.
Constats Cles
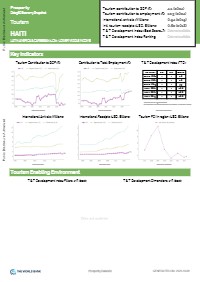
- Le tourisme contribue à 4,1% du PIB d'Haïti en 2024.
- Le secteur touristique représente 12,3% de l'emploi total en Haïti (2024).
- Haïti a reçu 0,94 million d'arrivées touristiques internationales en 2019.
- Les recettes touristiques internationales ont atteint 0,62 milliard de dollars en 2018.
- Haïti manque de données complètes pour les classements de l'Indice de Développement du Voyage et Tourisme.
Description Complete
Cet aperçu économique Prosperity Data360 de la Banque mondiale fournit une vue d'ensemble complète de la performance du secteur touristique haïtien et des indicateurs clés. Le document présente l'impact économique du tourisme, montrant que le secteur contribue à 4,1% du PIB d'Haïti et représente 12,3% de l'emploi total en 2024. Le rapport inclut des données historiques sur les arrivées internationales et les recettes touristiques, avec 0,94 million d'arrivées internationales enregistrées en 2019 et 0,62 milliard de dollars de recettes touristiques internationales en 2018.
L'aperçu couvre plusieurs dimensions du développement touristique incluant l'environnement favorable, les conditions politiques, l'infrastructure et les services, les ressources touristiques, et les facteurs de durabilité. Cependant, Haïti manque de données pour l'Indice de Développement du Voyage et Tourisme (TTDI), qui évalue les politiques et facteurs de développement touristique des pays à travers 17 piliers organisés en 5 dimensions.
Le document inclut des données comparatives positionnant Haïti dans la région Amérique latine et Caraïbes et la classification des pays à revenu intermédiaire inférieur. Il présente divers indicateurs de demande et d'offre touristiques, bien que de nombreuses métriques spécifiques pour Haïti ne soient pas disponibles, soulignant les défis potentiels de collecte de données dans le secteur touristique du pays.
Les notes méthodologiques expliquent les méthodes de calcul pour les indicateurs clés, soulignant que la contribution du tourisme au PIB inclut les dépenses directes des visiteurs, les dépenses gouvernementales touristiques, et les impacts économiques plus larges à travers les effets indirects et induits. Les données sont compilées à partir de plusieurs sources internationales incluant WTTC, UNWTO, WDI de la Banque mondiale, et le Forum économique mondial.
Texte Integral du Document
Texte extrait du document original pour l'indexation.
Public Disclosure Authorized Prosperity Data360 Economy Snapshot Tourism HAITI LATIN AMERICA & CARIBBEAN (LCN) ; LOWER MIDDLE INCOME Key Indicators Tourism contribution to GDP (%) 4.1 (2024) Tourism contribution to employment (%) 12.3 (2024) International arrivals (Millions) 0.94 (2019) Intl. tourism receipts (USD, Billions) 0.62 (2018) T & T Development Index (Best Score=7) Data not available T & T Development Index Ranking Data not available Tourism Contribution to GDP (%) Contribution to Total Employment (%) T & T Development Index (TTDI) Public Disclosure Authorized Indicator HTI S.R. World Score, 2024 - - 4.0 Score, 2021 - - 4.0 Score, 2019 - - 3.9 Rank, 2024 - - 60.0 Rank, 2021 - - 60.0 Rank, 2019 - - 60.0 Ranking out of 119 economies S.R. denotes the corresponding sub-region in the TTDI report SOURCE: WTTC SOURCE: WTTC SOURCE: WEF TTDI International Arrivals (Millions) International Receipts (USD, Billions) Tourism FDI in region (USD, Billions) Public Disclosure Authorized SOURCE: WDI SOURCE: WDI SOURCE: UNWTO Tourism Enabling Environment Public Disclosure Authorized T & T Development Index Pillars, 1-7 (best) T & T Development Dimensions, 1-7 (best) Prosperity Data360 GENERATED ON: 2025-10-08 Tourism Supply Marine Protected areas (% of territorial waters) Terrestrial Protected areas (% of total land area) SOURCE: WDI SOURCE: WDI Number of rooms (Thousands) Occupancy rate / rooms (%) SOURCE: UNWTO SOURCE: UNWTO Tourism Demand International Tourist Arrivals (Millions) International Tourism Receipts (Current US$, Billions) Travel Services (% of commercial service exports) SOURCE: WDI SOURCE: WDI SOURCE: WDI Prosperity Data360 GENERATED ON: 2025-10-08 Methodological Notes Tourism contribution to GDP. Refers to the Travel and Tourism’s total contribution to GDP, which equals the internal Travel & Tourism consumption (i.e. visitor spending, domestic resident Travel & Tourism expenditure, and government individual Travel & Tourism spending) minus the purchases (including imports) by Travel & Tourism providers, as well as its wider impacts on the economy (i.e. the indirect and induced impacts). More information can be found at the WTTC/Oxford Economics 2023 Travel & Tourism Economic Impact Research Methodology of May 2023. Tourism contribution to total employment. Refers to Travel and Tourism total employment and it is calculated in different ways depending on whether the economy has a TSA, input-output tables, or none of those. More information can be found at the WTTC/Oxford Economics 2023 Travel & Tourism Economic Impact Research Methodology of May 2023. T & T Development Index. The Travel & Tourism Development Index (TTDI) benchmarks and measures the set of factors and policies that enable the sustainable and resilient development of the Travel and Tourism (T&T) sector, which in turn contributes to the development of an economy. The TTDI is calculated as an average (arithmetic mean) of 17 component pillar averages (arithmetic means), organized into 5 dimensions: 1. Enabling Environment (five pillars): 1. Business Environment; 2. Safety and Security; 3. Health and Hygiene; 4. Human Resources and Labour Market; 5. ICT Readiness 2. T&T Policy and Enabling Conditions (three pillars): 6. Prioritization of T&T; 7. Openness to T&T; 8. Price Competitiveness 3. Infrastructure and Services (three pillars): 9. Air Transport Infrastructure; 10. Ground and Port Infrastructure; 11. Tourist Services and Infrastructure 4. T&T Resources (three pillars): 12. Natural Resources; 13. Cultural Resources; 14. Non-Leisure Resources 5. T&T Sustainability (three pillars): 15. Environmental Sustainability; 16. T&T Socioeconomic Impact; 17. T&T Demand Sustainability More information can be found at the Technical notes and methodology of the TTDI 2024. International Tourist Arrivals and Receipts. Data are compiled by the UNWTO Secretariat based on preliminary data reported by the institutions of the various countries and territories. Receipts from international tourism are a services export in the countries’ balance of payments (the ‘travel’ item) which includes all transactions related to the consumption of goods and services by international visitors, such as accommodation, food and drink, fuel, domestic transport, entertainment, and shopping. Travel receipts do not include receipts from international passenger transport contracted from companies outside the travelers’ countries of residence. International tourism receipts account for exchange rate changes and inflation. More information can be found at the UNWTO World Tourism Barometer. Travel Services. Travel covers goods and services acquired from an economy by travelers for their own use during visits of less than one year in that economy for either business or personal purposes. Same as in the case of travel receipts, Travel Services include local transport (i.e., transport within the economy being visited and provided by a resident of that economy), but exclude international transport (which is included in passenger transport). Travel also excludes goods for resale, which are included in general merchandise. For more information, email us at: tourism@worldbankgroup.org Visit our Tourism and Competitiveness website. Prosperity Data360 GENERATED ON: 2025-10-08 Disclaimer The Prosperity Data360 platform only aggregates publicly available data and does not produce or own any mentioned data. Region and income group mapping followed in the data sheets are as per the official World Bank classification. Aggregates calculated do not include economies absent in the World Bank list. Economy borders or names do not necessarily reflect the World Bank Group's official position. Maps available through the Prosperity Data360 are for illustrative purposes and do not imply the expression of any opinion on the part of the World Bank, concerning the legal status of any economy or territory or concerning the delimitation of frontiers or boundaries. Prosperity Data360 GENERATED ON: 2025-10-08