
Charcoal in Haiti: A National Assessment of Charcoal Production and Consumption Trends
Summary — This World Bank study provides a comprehensive assessment of charcoal production and consumption patterns in Haiti through systematic monitoring of charcoal truck movements into Port-au-Prince. The research addresses critical data gaps about Haiti's charcoal sector and its economic significance.
Key Findings
- Total of 10,404 unique charcoal vehicle observations recorded over 384 hours of systematic monitoring.
- Charcoal supply to Port-au-Prince comes from all regions of Haiti including Southern Peninsula, Central Plateau, North, and eastern areas.
- Significant charcoal imports identified from the Dominican Republic.
- Hurricane Matthew had measurable impact on charcoal production patterns.
- The charcoal sector represents a significant but underestimated component of Haiti's national economy.
Full Description
This comprehensive study examines charcoal production and consumption trends across Haiti, focusing particularly on supply chains feeding into Port-au-Prince. The research was conducted through systematic monitoring of charcoal transportation, with 69 enumerators stationed at 23 roadside locations recording 10,404 unique vehicle observations over 384 hours across three sampling periods in 2017. The study addresses critical information gaps about Haiti's charcoal sector, which has historically lacked reliable data despite its significant role in the national economy. The research methodology involved tracking charcoal trucks from all regions of Haiti - including the Southern Peninsula, Central Plateau, North, and areas east of Port-au-Prince - as well as imports from the Dominican Republic. The study also examines the impact of Hurricane Matthew on charcoal production patterns. Beyond quantitative analysis, the research explores the economic value of the charcoal market, employment implications, and regional variations in production and supply chains. The findings provide essential baseline data for policy makers and highlight the need for evidence-based approaches to managing Haiti's charcoal sector while addressing deforestation concerns.
Full Document Text
Extracted text from the original document for search indexing.
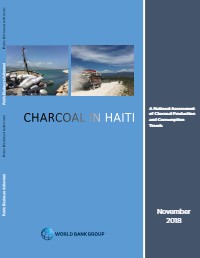
Public Disclosure Authorized Public Disclosure Authorized Public Disclosure Authorized Public Disclosure Authorized A National Assessment of Charcoal Production and Consumption Trends November 2018 CHARCOAL in Haiti A National Assessment of Charcoal Production and Consumption Trends Andrew Tarter, Ph.D., anthropologist (principal investigator; lead author) Katie Kennedy Freeman, agricultural economist (World Bank Group) Christopher Ward, consultant (World Bank Group) Klas Sander, Ph.D., natural resources economist (World Bank Group) Kenson Theus, sociologist, Haiti Takes Root (research team leader, J/P HRO) Barbara Coello, economist (World Bank Group) Yarine Fawaz, economist (CEMFI) Melinda Miles, anthropologist, Haiti Takes Root (J/P HRO) Tarig Tagalasfia G. Ahmed, consultant, Humphrey Fellow (Cornell University) Financing for this study was provided by the Program on Forests (PROFOR) © 2017 International Bank for Reconstruction and Development/The World Bank 1818 H Street NW Washington DC 20433 Telephone: 202-473-1000 Internet: www.worldbank.org This work is a product of the staff of The World Bank with external contributions. The findings, interpretations, and conclusions expressed in this work do not necessarily reflect the views of The World Bank, its Board of Executive Directors, or the governments they represent. The World Bank does not guarantee the accuracy of the data included in this work. The boundaries, colors, denominations, and other information shown on any map in this work do not imply any judgment on the part of The World Bank concerning the legal status of any territory or the endorsement or acceptance of such boundaries. Contents ACKNOWLEDGMENTS . . . . . . . . . . . . . . . . . . . . . . . . . . . . . . . . . . . . . . . . . . . . . . . . . . . . . . . . . . . . . . . . . . . . . . . . . . . . . . . . . . . . . . . . v EXECUTIVE SUMMARY AND KEY FINDINGS . . . . . . . . . . . . . . . . . . . . . . . . . . . . . . . . . . . . . . . . . . . . . . . . . . . . . . . . . . . . . . . . . . . . vii I. INTRODUCTION AND BACKGROUND . . . . . . . . . . . . . . . . . . . . . . . . . . . . . . . . . . . . . . . . . . . . . . . . . . . . . . . . . . . . . . . . . . . . . . . . . 1 Introduction . . . . . . . . . . . . . . . . . . . . . . . . . . . . . . . . . . . . . . . . . . . . . . . . . . . . . . . . . . . . . . . . . . . . . . . . . . . . . . . . . . . . . . . . . . . . . . . 1 Background . . . . . . . . . . . . . . . . . . . . . . . . . . . . . . . . . . . . . . . . . . . . . . . . . . . . . . . . . . . . . . . . . . . . . . . . . . . . . . . . . . . . . . . . . . . . . . . . 1 Haitian Government Legislative and Executive Efforts to Address Deforestation . . . . . . . . . . . . . . . . . . . . . . . . . . . . . . . 1 The Original Forests of Haiti . . . . . . . . . . . . . . . . . . . . . . . . . . . . . . . . . . . . . . . . . . . . . . . . . . . . . . . . . . . . . . . . . . . . . . . . . . . . . 2 The Deforestation of Haiti . . . . . . . . . . . . . . . . . . . . . . . . . . . . . . . . . . . . . . . . . . . . . . . . . . . . . . . . . . . . . . . . . . . . . . . . . . . . . . . 2 Current Estimates of Arboreal Coverage in Haiti . . . . . . . . . . . . . . . . . . . . . . . . . . . . . . . . . . . . . . . . . . . . . . . . . . . . . . . . . . . 3 The Historical Production of Charcoal in Haiti . . . . . . . . . . . . . . . . . . . . . . . . . . . . . . . . . . . . . . . . . . . . . . . . . . . . . . . . . . . . . 6 The Use of Non-Charcoal Wood in Haiti . . . . . . . . . . . . . . . . . . . . . . . . . . . . . . . . . . . . . . . . . . . . . . . . . . . . . . . . . . . . . . . . . . . 6 The Historical Supply of Charcoal to Port-au-Prince . . . . . . . . . . . . . . . . . . . . . . . . . . . . . . . . . . . . . . . . . . . . . . . . . . . . . . . . 7 Contemporary Charcoal Production in Port-au-Prince . . . . . . . . . . . . . . . . . . . . . . . . . . . . . . . . . . . . . . . . . . . . . . . . . . . . . . . 7 II. RESEARCH QUESTIONS AND METHODOLOGY . . . . . . . . . . . . . . . . . . . . . . . . . . . . . . . . . . . . . . . . . . . . . . . . . . . . . . . . . . . . . . . . 9 Research Questions . . . . . . . . . . . . . . . . . . . . . . . . . . . . . . . . . . . . . . . . . . . . . . . . . . . . . . . . . . . . . . . . . . . . . . . . . . . . . . . . . . . . . . . 9 Methodology . . . . . . . . . . . . . . . . . . . . . . . . . . . . . . . . . . . . . . . . . . . . . . . . . . . . . . . . . . . . . . . . . . . . . . . . . . . . . . . . . . . . . . . . . . . . . . 9 Principal Method . . . . . . . . . . . . . . . . . . . . . . . . . . . . . . . . . . . . . . . . . . . . . . . . . . . . . . . . . . . . . . . . . . . . . . . . . . . . . . . . . . . . . . . . 9 Methodological Similarities and Differences from Previous Studies . . . . . . . . . . . . . . . . . . . . . . . . . . . . . . . . . . . . . . . . . . 9 Timeframe of the Fieldwork Scoping . . . . . . . . . . . . . . . . . . . . . . . . . . . . . . . . . . . . . . . . . . . . . . . . . . . . . . . . . . . . . . . . . . . . . . 9 Sampling . . . . . . . . . . . . . . . . . . . . . . . . . . . . . . . . . . . . . . . . . . . . . . . . . . . . . . . . . . . . . . . . . . . . . . . . . . . . . . . . . . . . . . . . . . . . . . . . 10 Spatial Sampling: Core and Periphery . . . . . . . . . . . . . . . . . . . . . . . . . . . . . . . . . . . . . . . . . . . . . . . . . . . . . . . . . . . . . . . . . . . . 10 Data Standardization . . . . . . . . . . . . . . . . . . . . . . . . . . . . . . . . . . . . . . . . . . . . . . . . . . . . . . . . . . . . . . . . . . . . . . . . . . . . . . . . . . 13 III. RESULTS . . . . . . . . . . . . . . . . . . . . . . . . . . . . . . . . . . . . . . . . . . . . . . . . . . . . . . . . . . . . . . . . . . . . . . . . . . . . . . . . . . . . . . . . . . . . . . . . 15 Descriptive Statistics . . . . . . . . . . . . . . . . . . . . . . . . . . . . . . . . . . . . . . . . . . . . . . . . . . . . . . . . . . . . . . . . . . . . . . . . . . . . . . . . . . . . . 15 Differences between the Three Sampling Periods . . . . . . . . . . . . . . . . . . . . . . . . . . . . . . . . . . . . . . . . . . . . . . . . . . . . . . . . . . . . 16 Comparison of All Three Sampling Periods Based on One Shared Day . . . . . . . . . . . . . . . . . . . . . . . . . . . . . . . . . . . . . . . 16 Comparison of All Sampling Periods Based on Total Shared Hours . . . . . . . . . . . . . . . . . . . . . . . . . . . . . . . . . . . . . . . . . 16 Reconstruction of the Peak Week . . . . . . . . . . . . . . . . . . . . . . . . . . . . . . . . . . . . . . . . . . . . . . . . . . . . . . . . . . . . . . . . . . . . . . . . 17 Robustness Check on Number of Trucks . . . . . . . . . . . . . . . . . . . . . . . . . . . . . . . . . . . . . . . . . . . . . . . . . . . . . . . . . . . . . . . . . . 17 Variation within Days and across the Week . . . . . . . . . . . . . . . . . . . . . . . . . . . . . . . . . . . . . . . . . . . . . . . . . . . . . . . . . . . . . . . . . 20 Regional Differences . . . . . . . . . . . . . . . . . . . . . . . . . . . . . . . . . . . . . . . . . . . . . . . . . . . . . . . . . . . . . . . . . . . . . . . . . . . . . . . . . . . . . 22 The Effects of the Farthest Periphery Stations and Feeder Roads . . . . . . . . . . . . . . . . . . . . . . . . . . . . . . . . . . . . . . . . . . 23 The Southern Peninsula . . . . . . . . . . . . . . . . . . . . . . . . . . . . . . . . . . . . . . . . . . . . . . . . . . . . . . . . . . . . . . . . . . . . . . . . . . . . . . . . 23 Central Plateau . . . . . . . . . . . . . . . . . . . . . . . . . . . . . . . . . . . . . . . . . . . . . . . . . . . . . . . . . . . . . . . . . . . . . . . . . . . . . . . . . . . . . . . . 26 North . . . . . . . . . . . . . . . . . . . . . . . . . . . . . . . . . . . . . . . . . . . . . . . . . . . . . . . . . . . . . . . . . . . . . . . . . . . . . . . . . . . . . . . . . . . . . . . . . 28 East of Port-au-Prince . . . . . . . . . . . . . . . . . . . . . . . . . . . . . . . . . . . . . . . . . . . . . . . . . . . . . . . . . . . . . . . . . . . . . . . . . . . . . . . . . 30 A National Assessment of Charcoal Production and Consumption Trends iii Charcoal Entering Haiti from the Dominican Republic . . . . . . . . . . . . . . . . . . . . . . . . . . . . . . . . . . . . . . . . . . . . . . . . . . . . . . . . 30 Estimates of Charcoal Entering Haiti from the Dominican Republic . . . . . . . . . . . . . . . . . . . . . . . . . . . . . . . . . . . . . . . . . 30 Alternative Hypotheses Concerning Charcoal Entering from the Dominican Republic . . . . . . . . . . . . . . . . . . . . . . . . . 30 IV. ANALYSIS . . . . . . . . . . . . . . . . . . . . . . . . . . . . . . . . . . . . . . . . . . . . . . . . . . . . . . . . . . . . . . . . . . . . . . . . . . . . . . . . . . . . . . . . . . . . . . . 33 Estimated Annual Consumption in Port-au-Prince . . . . . . . . . . . . . . . . . . . . . . . . . . . . . . . . . . . . . . . . . . . . . . . . . . . . . . . . . . . 33 Changes in the Regional Supply of Charcoal to Port-au-Prince . . . . . . . . . . . . . . . . . . . . . . . . . . . . . . . . . . . . . . . . . . . . . . . . 34 Estimated Annual Consumption at the National Level . . . . . . . . . . . . . . . . . . . . . . . . . . . . . . . . . . . . . . . . . . . . . . . . . . . . . . . 36 Economic Value of the Charcoal Market . . . . . . . . . . . . . . . . . . . . . . . . . . . . . . . . . . . . . . . . . . . . . . . . . . . . . . . . . . . . . . . . . . . . 36 Charcoal as Compared to GDP . . . . . . . . . . . . . . . . . . . . . . . . . . . . . . . . . . . . . . . . . . . . . . . . . . . . . . . . . . . . . . . . . . . . . . . . . . 37 Charcoal Related to Other Commodities . . . . . . . . . . . . . . . . . . . . . . . . . . . . . . . . . . . . . . . . . . . . . . . . . . . . . . . . . . . . . . . . . 38 Employment in the Charcoal Market . . . . . . . . . . . . . . . . . . . . . . . . . . . . . . . . . . . . . . . . . . . . . . . . . . . . . . . . . . . . . . . . . . . . . . . 39 V. IMPACT OF MATTHEW ON CHARCOAL PRODUCTION . . . . . . . . . . . . . . . . . . . . . . . . . . . . . . . . . . . . . . . . . . . . . . . . . . . . . . . . 41 Hurricane Matthew . . . . . . . . . . . . . . . . . . . . . . . . . . . . . . . . . . . . . . . . . . . . . . . . . . . . . . . . . . . . . . . . . . . . . . . . . . . . . . . . . . . . . . . . 41 VI. CONCLUSION . . . . . . . . . . . . . . . . . . . . . . . . . . . . . . . . . . . . . . . . . . . . . . . . . . . . . . . . . . . . . . . . . . . . . . . . . . . . . . . . . . . . . . . . . . . . 43 Research Questions . . . . . . . . . . . . . . . . . . . . . . . . . . . . . . . . . . . . . . . . . . . . . . . . . . . . . . . . . . . . . . . . . . . . . . . . . . . . . . . . . . . . . . 43 Explaining Increases in Production . . . . . . . . . . . . . . . . . . . . . . . . . . . . . . . . . . . . . . . . . . . . . . . . . . . . . . . . . . . . . . . . . . . . . . . . . 45 The Sustainability of Haitian Charcoal Woodlot Systems . . . . . . . . . . . . . . . . . . . . . . . . . . . . . . . . . . . . . . . . . . . . . . . . . . . . 48 Social and Ecological Sustainability . . . . . . . . . . . . . . . . . . . . . . . . . . . . . . . . . . . . . . . . . . . . . . . . . . . . . . . . . . . . . . . . . . . . . 48 Improving Existing Woodlot Systems . . . . . . . . . . . . . . . . . . . . . . . . . . . . . . . . . . . . . . . . . . . . . . . . . . . . . . . . . . . . . . . . . . . . 48 VII. POLICY IMPLICATIONS . . . . . . . . . . . . . . . . . . . . . . . . . . . . . . . . . . . . . . . . . . . . . . . . . . . . . . . . . . . . . . . . . . . . . . . . . . . . . . . . . . . 51 The Charcoal Industry in the National Economy . . . . . . . . . . . . . . . . . . . . . . . . . . . . . . . . . . . . . . . . . . . . . . . . . . . . . . . . . . . . . 51 Implication of Charcoal Production Stigma on Policies . . . . . . . . . . . . . . . . . . . . . . . . . . . . . . . . . . . . . . . . . . . . . . . . . . . . . . . 51 Policy Designs Inhibited by a Lack of Data on Charcoal Sector . . . . . . . . . . . . . . . . . . . . . . . . . . . . . . . . . . . . . . . . . . . . . . . 52 VIII. AREAS OF ADDITIONAL RESEARCH . . . . . . . . . . . . . . . . . . . . . . . . . . . . . . . . . . . . . . . . . . . . . . . . . . . . . . . . . . . . . . . . . . . . . . 53 Undertake Additional Research on Key Facets of the Charcoal Sector . . . . . . . . . . . . . . . . . . . . . . . . . . . . . . . . . . . . . . . . . 53 Undertake Additional Work in the Policy Space . . . . . . . . . . . . . . . . . . . . . . . . . . . . . . . . . . . . . . . . . . . . . . . . . . . . . . . . . . . . . . 54 IX. REFERENCES . . . . . . . . . . . . . . . . . . . . . . . . . . . . . . . . . . . . . . . . . . . . . . . . . . . . . . . . . . . . . . . . . . . . . . . . . . . . . . . . . . . . . . . . . . . . 55 X. ANNEXES . . . . . . . . . . . . . . . . . . . . . . . . . . . . . . . . . . . . . . . . . . . . . . . . . . . . . . . . . . . . . . . . . . . . . . . . . . . . . . . . . . . . . . . . . . . . . . . . . 59 Annex 1—Fieldwork Timeframe Phases . . . . . . . . . . . . . . . . . . . . . . . . . . . . . . . . . . . . . . . . . . . . . . . . . . . . . . . . . . . . . . . . . . . . 59 Annex 2—Logistical Details about the Survey . . . . . . . . . . . . . . . . . . . . . . . . . . . . . . . . . . . . . . . . . . . . . . . . . . . . . . . . . . . . . . 59 Annex 3—Possible Sources of Errors and Adopted Mitigation Measures . . . . . . . . . . . . . . . . . . . . . . . . . . . . . . . . . . . . . . . 62 Annex 4—Complementary Analysis . . . . . . . . . . . . . . . . . . . . . . . . . . . . . . . . . . . . . . . . . . . . . . . . . . . . . . . . . . . . . . . . . . . . . . . . 63 Annex 5—Post-Hurricane Matthew Arboreal Assessment . . . . . . . . . . . . . . . . . . . . . . . . . . . . . . . . . . . . . . . . . . . . . . . . . . . . 64 Annex 6—The Gendered Aspects of Charcoal Production . . . . . . . . . . . . . . . . . . . . . . . . . . . . . . . . . . . . . . . . . . . . . . . . . . . . . 68 iv Charcoal in Haiti Acknowledgments The report is a product of the Agriculture Global Practice of the World Bank. It was prepared by a team led by Katie Kennedy Freeman (Agriculture) and Klas Sander (Environment) and authored by anthropologist and expert consultant Andrew Tarter, PhD. Research was led by a team from nonprofit organization J/P HRO in conjunction with the Haiti Takes Root initiative. The final report considers feedback from multiple experts across various institutions. The authors would like to thank the peer reviewers, Dana Rysankova (Senior Energy Specialist), Joanne Gaskell (Senior Agriculture Economist), Andrew Mitchell (Senior Forestry Specialist), and Erika Felix (Bioenergy Specialist, Food and Agriculture Organization of the UN (FAO)). In addition, the team would like to thank Raju Singh (Program Leader), Pierre Xavier Bonneau (Program Leader), Preeti Ahuja (Practice Manager Agriculture), and Valerie Hickey (Practice Manager Environment) for their support and guidance. The team acknowledges and thanks the Program on Forests (PROFOR) for supporting this research and publication. A National Assessment of Charcoal Production and Consumption Trends v Executive Summary and Key Findings A widely cited report from 1979 suggested that existing wood supplies in Haiti would be enough to meet increasing charcoal demand until around the year 2000, but that ongoing charcoal production could result in an environmental ‘apocalypse’ (Voltaire 1979, 21, 23) The prediction that wood supplies in Haiti would be exhausted by 2000 was also supported by a report on trends emerging from early remote sensing analyses of aerial photographs spanning from 1956 to 1978, for three different locations in Haiti (Cohen 1984, v–iv). And yet, some 40 years later, Haitians continue to produce large quantities of charcoal despite these dire predictions to the contrary. The research presented in this report directly addresses important and unresolved questions stemming from the unexpected fact that Haitians continue to meet approximately 80 percent of their national energy needs through firewood and charcoal production: 1. How much charcoal is consumed annually in the capital city of Port-au-Prince? 2. Which geographical regions produce the charcoal consumed in the capital? 3. How do these production areas variably supply charcoal to the capital? 4. In what ways have these trends changed over time? and 5. What percentage of charcoal is originating from the bordering Dominican Republic? This report draws on research spanning nearly half a century to answer these questions, presenting both longitudinal and cross-sectional data related to multiple aspects of charcoal production and consumption in Haiti. Data collection spanned two years, commencing in 2016 with literature reviews, key informant interviews, and regional scouting trips across Port au-Prince and Haiti to identify the best locations to position research teams with the objective of enumerating passing charcoal trucks and boats. These preliminary stages were followed by three different periods of roadside sampling to count passing trucks (August 2017, October 2017, and December 2017) that amounted to a total of 384 hours of observations, registering 10,404 unique enumerations of charcoal vehicles by 69 enumerators placed at 23 different roadside stations that controlled charcoal vehicles at multiple intersections of roads or maritime wharfs leading into Port-au-Prince from every direction of the country.1 The estimations and subsequent extrapolations presented here are conservative, using midrange estimates on a number of variables, including charcoal bag carrying capacities for different-sized vehicles in the classificatory typology, an average weight assumption for charcoal bags, and the utilization of annual extrapolation methods (for Port-au-Prince and all of Haiti) based on extending data sampled during representative low and peak periods of charcoal production to corresponding low and peak seasons across the entire year. This research provides targeted answers to a narrow set of research questions, helping to fill an important information gap in Haiti. Most notably, the total volume of charcoal moving into Port-au-Prince has implications on the total required volume of primary production of biomass for charcoal and the total value of the charcoal value chains, demonstrating the magnitude of importance of charcoal production for Haiti. These two up-to date figures may inform policy decisions for development and government programming related to landscape management, reforestation, tree planting, agroforestry, and agricultural projects in Haiti. 1The research design also controlled for every known and relevant vehicular point of entry from the Dominican Republic at the time of the research. The authors acknowledge that charcoal may be entering Haiti from Route National Number 6, along the northern coast of Haiti, or through wharfs along the northern coast of Haiti (the only known major entry routes not controlled for). However, such charcoal would most certainly be headed to the nearby city of Cap Haitian, or other urban towns north of Haiti. A National Assessment of Charcoal Production and Consumption Trends vii Key Findings and Conclusions The data and analyses permitted conclusions and estimates that help contextualize the enormity of charcoal production in Haiti in terms of scale, geographic scope, economic impact, and employment generation. All key findings and conclusions briefly summarized here are supported in more detail in the main body of the report. The main findings of the research are: • Approximately 438,000 metric tons of charcoal are consumed annually in Port-au-Prince. The annual charcoal consumption range for Port-au Prince is based on 24/7 counts at six key enumeration stations controlling for the largest known charcoal entry points into the capital. Extrapolating from two weeks of sampling data (one week of sampling data from a peak charcoal production season and one week from a low production season), an estimated 352,014 to 524,394 metric tons, with a midrange estimate of 438,204 metric tons of charcoal are consumed annually in Port-au-Prince. • Approximately 946,500 metric tons of charcoal are consumed nationally in Haiti each year. The estimated annual charcoal consumption range for Haiti at the national level is based on a tons-to-population ratio created from the annual estimate for Port-au Prince—by far the largest city and largest consumer of charcoal in the country. The tons-to-population ratio was applied to the entire urban population of Haiti2 (inclusive of Port-au-Prince) as last reported by the Haitian government (IHSI 2015), suggesting a range between 759,470 and 1,133,537 metric tons, with an estimated midpoint of 946,506 metric tons of charcoal consumed nationally in Haiti each year. • Charcoal production is the second-largest agricultural value chain in Haiti. The charcoal sector’s outsized influence on Haiti’s economy is evidenced by its size relative to other agricultural commodities. It is the second largest agriculture value chain in the country, behind only mangoes, and dwarfing most other traditional pillars of the Haitian 2Charcoal is primarily produced rurally and consumed in urban locations. In rural locations Haitian use firewood for cooking. rural economy, such as yams, bananas, beans, avocados, coffee, sugarcane, and corn. • Contrary to popular conception, the data show that a negligible amount of the charcoal consumed in Port-au-Prince, Haiti, originates in the Dominican Republic. Across five different enumeration stations controlling for charcoal entering Haiti from the Dominican Republic, the total amount of charcoal observed in the research presented in this report is equivalent to 2.48 percent of the amount consumed in Port-au-Prince during that same period.3 Other key findings include: • Researchers are approaching consensus that current arboreal land coverage in Haiti is significantly higher than previously believed. Since the early 1980s, the Haitian government has stated that in ideal conditions (given realities of topography, geology, and meteorology) some 35–55 percent of the land surface of Haiti should be covered forests. Five recent land-cover studies have concluded that Haiti has a much higher than conventionally reported level of tree cover and/or forest cover,4 with many reports estimating present tree coverage in Haiti at approximately 30 percent of the land surface. • There are clear annual low and peak seasons of charcoal production in Haiti. Evidence presented here demonstrates that charcoal production fluctuates significantly during the course of a year; there are clear peak and low seasons of charcoal production, typically lasting approximately six months each. Unexpected events such as disasters, droughts, agricultural pests, tropical storms, or political unrest—which disrupt the traditional agricultural calendar—may shift, shorten, or extend low and peak charcoal production seasons 3These data are supported by other research, suggesting that the percentage of official charcoal exports from the Dominican Republic to Haiti has declined significantly over the last two decades, while Dominican exports to overseas markets have surged. In 2001, Haiti received over 50 percent of official Dominican charcoal exports, which were valued at only US$4k. By 2012, the value of Dominican charcoal exports had grown to between US$500,000 to US$1,200,000, and exports were exclusively to the U.S., Europe, and the Middle East, indicating new charcoal markets of higher value were found elsewhere. 4Definitions of forest and tree cover vary, but controlling for differences in definitions, many studies converge at or near 30 percent. viii Charcoal in Haiti in Haiti. It is likely that market fluctuations—either of price or of supply and demand—have a similar effect. • Charcoal production in Haiti is now decentralized throughout the country. The addition of approximately 1,200 new feeder roads (remote, smaller roads that later join national highways) since the late 1960s and improvements to existing roads have opened up most remaining areas in the country and permitted the decentralization of charcoal production in Haiti. • The national decentralization of charcoal production in Haiti has resulted in less pressure on some traditional production areas, permitting arboreal recovery and subsequent return to charcoal production. Although charcoal production has reached most corners of the country, decentralization has relieved pressure on traditional production areas, permitting natural arboreal regeneration and a return to increased charcoal activities. • The differential supply of charcoal to Port-au Prince by region has shifted over time as a function of the influences of decentralization, changes to transportation, and arboreal recovery in historical production zones. Presently, the following geographical regions differentially supply charcoal to Port-au-Prince. The relative contributions from the following regions represent all the charcoal consumed in Port-au-Prince during our combined sampling periods: northwest (1%); island of La Gonâve (3.4%); Artibonite (9.7%); Central Plateau (20.3%); east of Port-au-Prince (18%); the southern (Tiburon) peninsula (41%); southeast (4.2%); due south of Port au-Prince/Kenscoff/Furcy (0.1%); and the Dominican Republic (2.3%). • Regionally, the largest charcoal supplier to Port-au-Prince is the southern peninsula, and the three top charcoal production locations together produce approximately 80 percent of the charcoal consumed in Port-au-Prince. The Tiburon peninsula registered 41 percent of the total charcoal supplied to the capital. This position as the largest regional supplier of charcoal to Port-au-Prince has remained above 30 percent since 1978. The second and third largest suppliers of charcoal to the capital are the Central Plateau (20.3%) and the area east of Port au-Prince (18%). Together with the southern peninsula (41.0%), these top three locations supply nearly 80 percent of the charcoal consumed in the capital. • The volume of charcoal counted at the farthest, most remote enumeration stations registered an amount equivalent to one-half of the total amount entering the capital. The four enumeration stations farthest from Port-au-Prince registered an amount of charcoal equivalent to approximately half the charcoal consumed in the capital during the same time period, demonstrating that high volumes of charcoal production occur at the far reaches of the country. • The amount of charcoal emerging from areas penetrated by feeder roads established since the late 1960s is equivalent to approximately one third of the quantity consumed in the capital during that same period of time. These ‘feeder roads’ demonstrate the high level of decentralization of charcoal production in Haiti and the production capacity of these remote locations. • Maritime charcoal transport in Haiti has decreased in significance. While historically boats carried large percentages of charcoal into Port-au-Prince, data presented here show the total volume of maritime charcoal counted at the wharfs sampled at an amount equivalent to 6.7 percent of the charcoal consumed in the capital during the same period. This is likely a result of new and improved roads and road transport. • The overall production of charcoal has increased in all geographical areas of Haiti, even as relative supply of some areas has decreased. The annual estimate for charcoal consumed in Port-au Prince is at least five times the amount from a similar study in 1985, suggesting that overall charcoal production has increased in virtually every area sampled, including those that show a decline in the relative percent of charcoal supplied to Port-au-Prince. • Haitians are not only still meeting their woodfuel needs, they are also producing charcoal at higher volumes, not only from new locations, but also from many of the same historical production regions. This suggests that at least part of the charcoal being produced in Haiti is made with biomass resources that are renewable. • Total charcoal sales in Port-au-Prince, Haiti, are approximately US$182 million per year. A National Assessment of Charcoal Production and Consumption Trends ix The average cost of a large sack of charcoal was approximately 800 Haitian Gourdes (US$12.42) from July–August 2018. Using these figures, the total estimated value of the charcoal market in Port-au Prince is US$182 million per year. • At the national level, total charcoal sales across Haiti are an estimated US$392 million per year. Using the same values for the price of charcoal as used in the Port-au-Prince calculation, the total value of the national charcoal market is an estimated US$392 million per year. • Based on the calculations of total sales, charcoal represents approximately 5 percent of Haiti’s GDP. The economic significance of the charcoal industry in Haiti can also be placed in context by comparing it to national GDP. Based on 2017 figures, charcoal represents 4.7 percent of GDP (US$8.408 billion). • Charcoal is over six times more valuable than Haiti’s total agriculture-related export market. When charcoal’s estimated national annual value (US$392,026,140) is compared to 2016 exports of crop and livestock products, charcoal is six times more valuable than all of these exports combined (US$62,479,200). Comparing to individual export commodities, charcoal is over 15 times more valuable than the highest-valued export in 2016 (essential oils; US$25.5 million in exports), 30 times more valuable than cacao exports (US$13.2 million), over 40 times more valuable than mango exports (US$9.2 million), and a startling 650 times more valuable than coffee exports (US$611,000). The results of this study vividly underscore that in Haiti, charcoal is big business.5 Indeed, based on initial calculations described above, charcoal is the second largest agriculture related value chain in the country. With a total market size in Port-au-Prince of approximately US$182 million per year and a national market value of approximately US$392 million per year, charcoal is one of Haiti’s most important crops. It contributes nearly 5 percent to GDP and has large impacts for employment in rural areas. 5A recent study in the Haitian newspaper Le Nouvelliste references so-called ‘charcoal millionaires’. The charcoal sector’s large—and likely growing—scale stands in stark contrast to the decades of apocalyptic predictions of the rapidly approaching day when a charcoal maker would fell Haiti’s last tree. This dynamic sector has continued to defy these forecasts through an intriguing combination of increased geographic reach and the evolution of more sustainable production techniques, relying on sources of renewable biomass. This study and its innovative charcoal rapid-assessment methodology highlight important new steps in growing efforts to understand the charcoal sector in Haiti. The data presented here shed additional light on charcoal—a poorly understood commodity with multifaceted and far-reaching impacts on Haiti’s economy and environment. The persistent stigmatization of charcoal as a dirty, destructive, and illegal fuel source tends to lead to calls for controls on production, or for the replacement of charcoal with other, often more expensive, sources of imported cooking fuels. With these aspects more fully considered, policy makers have the opportunity to capitalize on the economic, environmental, and energy policy opportunities offered by charcoal production in Haiti. Despite these promising aspects, any such efforts to leverage these economic, environmental and energy opportunities need to equally recognize and mitigate the negative outcomes associated with charcoal production. In particular, the health risks related to the use of charcoal for cooking. This study’s narrow focus examining volumes of charcoal transported to Port au Prince, charcoal origin, and historical trends, does not consider the health impacts of the use of charcoal. However, large bodies of ongoing research by the World Health Organization (WHO), Global Alliance for Clean Cookstoves, academic researchers, and other organizations are carefully examining the relationship between health outcomes and cooking fuels/cooking practices. Although much work is still under way to define precisely where biomass stoves and fuels become harmful, it is widely accepted that the use of charcoal for cooking is more hazardous than modern alternatives like Liquid Propane Gas (LPG), natural gas, and electricity. When developing policy related to charcoal, health aspects need to be prioritized and further researched. Addressing, mitigating, and improving all aspects of the charcoal industry requires additional research and the collation of existing research on: the characteristics of the x Charcoal in Haiti charcoal value chain and its many actors; price behaviors and trends; agronomic analyses of current wood energy production techniques by farmers; measures of sustainability and the renewability of charcoal production under different conditions and in different settings; aspects of environmental degradation and/or improvement; cleaner kilns on the production side; safe labor and working conditions on the transportation side; cleaner burning stoves and ventilation systems on the consumption side; and charcoal consumption habits and preferences. Such knowledge, combined with an increasing openness toward engaging in and improving the sector, could provide significant improvements to one of Haiti’s largest value chains. A National Assessment of Charcoal Production and Consumption Trends xi I. Introduction and Background Introduction Deforestation and charcoal production in Haiti are widely misunderstood phenomena. This is perhaps nowhere more evident than the misplaced belief that charcoal production is the principal driver of deforestation. It is a well-documented historical fact that Haiti’s primordial forests of valuable hardwoods largely vanished as a result of a series of other historical events, highlighted subsequently. In the present era, it is widely believed that some 2 percent of primordial forests remain in Haiti, despite that approximately one-third of the surface of Haiti remains covered in trees that supply the necessary woody biomass for ongoing charcoal production at the national level. Misinformation about deforestation and charcoal production in Haiti spread as part of a larger, global phenomenon: the so-called ‘woodfuel crisis’ of the 1970s and 1980s.6 This belief drove development planning during those decades and continues to drive popular but misinformed myths around woodfuel use in Haiti and beyond.7 To illustrate, a widely cited report from 1979 suggested that existing wood supplies in Haiti were enough to meet increasing charcoal demand until around the year 2000, but would ultimately result in an environmental ‘apocalypse’.8 The prediction that wood supplies would be exhausted by 2000 was also supported by a report on trends emerging from the early remote sensing analyses of aerial photographs spanning from 1956 to 1978, in three different locations in Haiti.9 Forty years later, Haiti is still covered with trees,10 and Haitians continue to produce large quantities of charcoal to supply their domestic energy needs. This report directly addresses important and unresolved questions about charcoal production. Since Haitians meet 6Eckholm 1975, 1984. 7Leach and Mearns 1988; Mwampamba et al. 2013; Arnold and Dewees 1997; Hansfort and Mertz 2011; Bailis et al. 2017. 8Voltaire 1979, 21, 23. 9Cohen 1984, v–iv. 10Tarter 2016; Tarter et al. 2016. approximately 80 percent of their national energy needs for cooking through firewood and charcoal production,11 a deeper understanding of current charcoal production in Haiti in the context of a historical perspective is crucial to inform policy decisions for development and government programming related to landscape management, reforestation, tree planting, agroforestry, and agricultural projects in Haiti. The methodology for data collection was drawn from research spanning nearly half a decade to allow for comparison with previous results. The following section presents a brief review of historical and contemporary knowledge to address widespread misinformation and misconceptions about tree cover, forest cover, and deforestation in Haiti, setting the context for the research questions and methodologies subsequently presented. Background Haitian Government Legislative and Executive Efforts to Address Deforestation The first Haitian government efforts to slow the cutting of trees in Haiti were enacted in 1804, the year of Haitian independence, although they were driven more by agricultural production considerations rather than strictly environmental concerns (Bellande 2010, 3). Throughout the 19th century, various Rural Codes provided strictures against the cutting of trees in and around mountain ridges, natural springs, and the banks of rivers (see Bellande 2010 and Bellande 2015 for extensive details)—a strategy reflective of an understanding of linked human and environmental influences. 11Charcoal in Haiti is used principally for cooking in urban areas, while wood is used for cooking in rural areas, although wood is used to a much lesser extent in urban bakeries and urban drycleaners. A National Assessment of Charcoal Production and Consumption Trends 1 Such 19th century Haitian government legislation has addressed the ownership, utilization, protection, control, restoration, marketing, and establishment of reserves for natural resources for:12 Forests: the Law of February 3, 1926; Law of August 20, 1955; the Rural Code of May 24, 1962, Law No. VIII; Decree of March 18, 1968; Decree of November 21, 1972; Decree of November 20, 1974. Soil: the Rural Code of May 24, 1962, Law No. V; the Constitution, Article 22; and the Decree of June 16, 1977. Land use and agriculture (in terms of both state and private land): the Law of July 26, 1927; the Constitution, Article 22; the Rural Code of May 24, 1962, Laws No. IV and V; and the Law of August 11, 1975.13 The historical consensus is that while the Haitian government recognized early on the related challenges around proper land and natural resource management—and passed corresponding legislation to address these challenges—they were ultimately not equipped to effectively and equitably enforce these laws at the national level. While the exact percentage of tree or forest cover in Haiti during many of these historical periods is not well established, early historical records provide evidence, and several new studies have provided current arboreal coverage estimates. The Original Forests of Haiti Haiti was never fully cloaked in forests, largely due to the combined influence of geographical, topographical, and meteorological deterrents—the nation is located on the leeward (i.e., dry), western side of the island of Hispaniola, in the rain shadow of several large mountain ranges that block much of the precipitation carried on the northeastern and Caribbean trade winds. As a forester completing a survey of the Haiti’s timber reserves in 1945 confirmed: The appearance of many of the inland smaller mountains and plateaus does not indicate that they ever supported 12This list is illustrative, not necessarily comprehensive. 13USAID 1979, 19–27. much forest growth, and many rocky hillsides probably never supported heavy timber stands, even though the valleys and ravines are known to have yielded some high quality timber. A general survey of the country indicates that most of the stories of former vast timber resources of Haiti were probably greatly exaggerated. Even allowing for the difference in rainfall and topography between the North, West, and South coasts, it is still obvious that many of the mountainsides in the central zone and on the West coast were never covered with the heavy mixed vegetation of the Northeast and Southwest, nor with the pine forests of the higher mountain ranges of the Southeast.14 Estimates of initial forest cover and land capacity that have considered these natural determinants range from 35 percent (Haitian Ministry of Environment)15 to 55 percent forest cover (Haitian government’s forestry plan of 1975).16 Stated succinctly, Haiti was probably never more than roughly halfway covered with forests. The Deforestation of Haiti Many of the primordial forests of Haiti were felled during the colonial period to establish and support the plantation model of agricultural production that would become the precursor to modern industrialized agriculture. Subsequent tree felling was authorized through contracts established between the fledgling Haitian government and foreign timber concessionaries to pay off a post-independence war indemnity and the new republic’s early leaders.17 Cultural and religious beliefs spared some trees from felling, but both the Catholic and Protestant churches in Haiti later targeted these same species in concerted efforts to destroy them.18 While the exact percentage of tree or forest cover in Haiti during previous periods is unknown, several new studies have provided current arboreal coverage estimates, which are briefly presented below. 14Klein 1945, 5. 15World Bank 1982 (pg. 17), citing a 1980 report by the Haitian Government’s Département de l’Agriculture des Ressources Naturelles et du Développement Rural DARNDR—now ‘Ministère de l’Agriculture des Ressources Naturelles et du Développement Rural (MARNDR). 16USAID 1979: 33 17See Tarter et al. 2016 for a lengthy history of deforestation in Haiti. 18Tarter 2015b. 2 Charcoal in Haiti Current Estimates of Arboreal Coverage in Haiti A frequently cited figure that repeatedly finds its way into the development literature posits that Haiti is only 2 percent forested. One of the major issues of contention related to this estimate results from the paucity of available data concerning when the figure first surfaced; it was almost assuredly based on extrapolating trends from incomplete data into the future. It is also not clear if the 2 percent figure refers to an estimated percentage of remaining forests, and if so, whether or not it is based on the false assumption that 100 percent of Haiti was covered with forests at some point in the past—an assumption that discounts the known environmental determinants of forest cover (geographical, topographical, and meteorological) discussed above. Perhaps the 2 percent figure simply represents an estimate of overall forest land cover at the time of its formulation, although there is no solid empirical evidence that primordial (or primary) forests or forest patches in fact covered 2 percent of the land. Complicating the issue, how a ‘forest’ is defined and measured varies significantly by individual, discipline, and institution,19 casting increasing doubt on the validity of the 2 percent figure and what it actually represents.20 While the 2 percent estimate probably originated in reference to original, primordial forests, it discounts secondary forests, woodlands, managed woodlots, tree plantations, agroforestry systems, and the many trees found on farms. Until the recent availability and close examination of high resolution, remotely sensed (satellite) imagery, researchers estimating arboreal coverage in Haiti relied exclusively on field-site visits or qualitative assessments from aerial flyovers. Six recent research studies summarized here present data based on new satellite data, and reach conclusions contrary to conventionally accepted estimates and the belief that Haiti’s landscape is devoid of tree cover: 19Lund 2014 lists approximately 1,600 different established definitions for ‘forest’ and ‘forest land’. 20Tarter 2016. The Large Island of La Gônave, Offshore from Port-au-Prince21 In 2012, geographers conducted a land-use/land change analysis of the large island of La Gônave, offshore to the northwest of Port-au-Prince, using two high-resolution Landsat satellite images twenty years apart, from 1990 and 2010. Both photos were selected from late January—the middle of Haiti’s dry season—to control for seasonal variability in vegetation and cloud cover. For their classification, researchers considered five different land-cover types that were mutually exclusive and exhaustive of all land types in the area, including separate land category classifications for forests and shrubs. Several complementary and higher resolution satellite photographs were consulted for the accuracy assessment of the image classification, in combination with the analysts’ knowledge of the area and a two month field visit.22 While the overall percentage of the forest land cover decreased over 20 years by 22.7 percent, the majority of 1990 agricultural lands were converted to shrub (45.01%), forest lands (34.23%), and 56.2 percent of the eroded land area in 1990 had been revegetated in 2010. Overall, the shrub coverage in La Gônave increased by 87.4 percent from 1990 to 2010. The entire land surface of La Gônave in 2010 (excluding water and masking the < 2% cloud cover) was 40.4 percent covered with woody shrubs and 46.0 percent covered with forest. A Nationwide Estimate of Forest and Tree Cover in Haiti23 In an analogous study, a geographer, a geologist, and a natural resource management specialist estimated forest cover for the entire country of Haiti. The authors used 2010–2011 Landsat national satellite images of Haiti at 21White et al. 2013. 22A stratified random sample of validation points to ground-truth their classifications was used. The team averaged 61 verification points for each of the five land-use categories (n = 301 total), locating random geospatial coordinates with GPS units. The random sample strata were 15, 52-meter elevation increments, to look for elevation-based influences (White et al. 2013, 498). The overall accuracy of their 2010 classification was 87%, with a Kappa coefficient of 0.84. The results show that the percent of land area change on La Gônave from 1990 to 2010 for agricultural land, forest/DV, shrub, and barren/eroded land classes, were −39.73%, −22.69%, +87.37%, and −7.04%, respectively (White et al. 2013, 499). 23Churches et al. 2014. A National Assessment of Charcoal Production and Consumption Trends 3 Tree cover map produced by Churches et al. 2014 Bare/non-vegetated Shrub cover/herbaceous Tree cover Water Wetland No data the dry season. After a series of standard renderings and corrections, the authors reclassified their satellite images using FAO’s forest class definition, thereby creating a low and high range of percent tree cover.24 The results of the nationwide analyses showed that in 2010–2011, trees covered 29.4 percent to 32.3 percent of Haiti’s land surface,25 and that shrub areas accounted for 45.7 to 48.6 percent of the land surface.26 Rather than a thinly dispersed arboreal covering, trees are aggregated in fragments and patches (Churches et al. 2014). 24These image classifications were verified through the application of a stratified sample of 1,525 random reference points to higher resolution satellite imagery. Strata were based on the land use distributions from their initial classification (Churches et al. 2014, 209). Their ‘tree cover’ class had a users’ accuracy of 86% and a .81 Kappa statistic, and the overall classification accuracy ranged from 78% reference point counts to 83% class proportions. 25Includes ‘water’, ‘wetlands’, ‘bare/non-vegetated’, and ‘cloud’ categories. 26It should be noted that the Churches et al. 2014 study and the White et al. 2013 study used slightly different land-use classifications. Nevertheless, both studies use a single category that operationalizes trees in the same way, and similarly restricts smaller shrubs, and all other land uses. Said succinctly, the tree cover in both studies is similarly classified, though the non-tree cover category varies between studies. USAID Global Development Lab’s GeoCenter Land Cover Analysis of Haiti In 2016, the GeoCenter of USAID’s Global Development Lab undertook a land-cover analysis of Haiti in anticipation of a Notice of Funding Opportunity related to the U.S. Congressional earmark for reforestation efforts in Haiti. The analysis was based on different parameters applied to two different global datasets: (i) Hansen/ University of Maryland;27 and (ii) the World Forests28 global dataset. Using the second dataset and associated definition of ‘forest’, USAID estimated forests span 9 percent of Haiti’s land area. When applying FAO’s standard definition of tree cover29 for the first dataset, USAID found that 40 percent of Haiti’s l