

(2016) UrDI Canaan Area: Neighbourhood Plan for Canaan II
Summary — This UN-Habitat UrDI document is part of the 2016 planning package for the Canaan area of Port-au-Prince. It provides urban analysis, planning guidance or neighbourhood-level proposals for Canaan II within the Croix-des-Bouquets metropolitan expansion area.
Key Findings
- Adds UrDI planning coverage for Canaan II.
- Links settlement growth to land-use, infrastructure and risk planning.
- Belongs to the 2016 Canaan-area planning package.
- Tagged to Croix-des-Bouquets/Ouest rather than Port-au-Prince commune.
Full Description
Prepared under the Urban Development Initiative for the Canaan area, the document addresses rapid urban growth, land use, infrastructure, risk and settlement planning in and around Canaan II. It should be read with the broader Canaan diagnostic, strategic framework and urban structure plan.
Full Document Text
Extracted text from the original document for search indexing.
UrDI - Urban Structure Plan
3.2. CANAAN II
1
2
3
4
Section A
No-Built areas
Canaan II, located on the west of the central area of Canaan, has
a population of 12,100. It is considered a low density neighbourhood with 4.383 inhab. per km2 and therefore its densification
is encouraged. A large part of Canaan II borders the National
Road 1 to the south but there is almost no access from it to the
neighbourhood. The presence of quarries and the complex topography limit the availability of suitable lands.
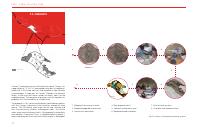
The proposals in this section are based on a participatory process
with the Canaan II community that lasted an average of three
months. The UN-Habitat team maps the existing situation and
then the community validates and proposes ideas. The LAB of
urban planning and design checks the proposed interventions
and modifies if necessary. Then, a neighbourhood assembly is
organized to present the vision and a land use plan is developed.
72
5
8
7
6
1. Mapping the existing situation
4. New proposals draft
7. Draft of land use plan
2. Mapping proposed interventions
5. Selected interventions map
8. Charrette and implementation
3. Community workshops
6. Neighbourhood assemblies
Fig.69: Canaan II: participatory planning process
U r b a n D e v e l o p m e n t I n i t i a t i v e ( U r D I ) f o r C a n a a n a r e a o f Po r t - A u - P r i n c e
A. STREET NETWORK
Currently, the street network occupies 8% of the total Canaan II area. There are just secondary
streets with the majority being dead-ends streets. The presence of roads in the northern and western parts is almost null thanks to the existence of quarries and steep slopes. Appropriate measures
on the construction of roads in steep areas have been further elaborated in the mobility report.
In the new plan of Canaan II, two arterial roads that connect the national road 1 with the northern
part are proposed. Where the topography is moderate, main roads are suggested to improve the
connectivity. Different widths are defined for the different types of roads (Option A and B, see below). The plan does not only propose new roads, but also looks into ways to improve and upgrade
the current situation. The new Canaan II road network plan shows an increase of 7.5%.
Existing situation
Proposed street network
Streets percentage
Streets percentage
15.5% -Option A
UN-Habitat: 30%
Arterial road: 24m
Main roads: 18m
Secondary streets: 12m
8%
- Option B
Arterial road: 18m
Main roads: 12m
Secondary streets: 9m
Streets km/sq.km
UN-Habitat: 18 km/sq.km
13.6 km/sq.km
Fig.70: Canaan II: existing street network
Fig.71: Canaan II: Proposed street network
Layers of the proposed street network
National road
Arterial road
Main roads
Secondary streets
Fig.72: Canaan II: Layers of the proposed street network
73
UrDI - Urban Structure Plan
B. PUBLIC SPACES
Existing Public Spaces
Fig.73: Canaan II: Existing Public spaces
#
PUBLIC SPACE CANAAN II
Proposed by UN-Habitat LAB
Proposed by the community
STATUS
NAME (IF ANY)
NEIGHBOURHOOD AREA
Fig.74: Canaan II: Public spaces proposed by the community
m2
Ha
%
100%
2760000
276
1
Public space
Existing
Terrain de football
660
0,07
2
Public space
Existing
Terrain de football
1.300
0,13
3
Public space
Existing
Parc
5.900
0,59
24
Other public spaces (13)
Existing
2.051
2
9.911
0,99
0,8984
4
Public space
Proposed by the community
8.984
5
Public space
Proposed by the community
2.490
0,249
22
Public space
Proposed by the community
3.384
0,3384
23
Public space
Proposed by the community
2.320
0,232
17.178
1,72
0,36%
0,62%
7
Public space
Proposed by the lab
2.527
0,2527
6
Public space
Proposed by the lab
2.203
0,2203
25
Public space
Proposed by the lab
200
0,02
4.930
0,49
0,18%
32.019
3,20
1,16%
Total:
Table 6. Canaan II: Percentage of public spaces
74
Fig.75: Canaan II: Public spaces proposed by UN-Habitat LAB
Canaan II has 24 small public spaces, two of them are football
fields and the other is a market. The total area of the existing
spaces is of 1 hectare consisting 0.37% of the total neighbourhood area. These spaces are located in south where the concentration of houses is abundant. To keep up with the recommendation of UN-Habitat, it is essential to consider vacant lots for the
development of new public spaces.
The results of the workshops highlighted the importance and
the need of having new public spaces. Considered as a priority, the community proposed to locate four spaces in the north.
Adding the community’s proposals to the existing situation, the
percentage of public spaces is still insufficient. For this reason,
the LAB suggested the establishment of two other spaces in the
north-eastern part. After the proposals of both parties, the number increased by 3Ha.
U r b a n D e v e l o p m e n t I n i t i a t i v e ( U r D I ) f o r C a n a a n a r e a o f Po r t - A u - P r i n c e
It is essential to guarantee from both sides of the ravine t a distance of 30-50 metres as a buffer zone. These areas were also
designed with the potential to become public spaces and not
just as protective spaces. If these proposals are implemented, the
designated public space in Canaan II would reach 10.8%.
Proposed public spaces with 400 metres buffer
Existing public spaces
Proposed by the community
Proposed by UN-Habitat LAB
#
STATUS
m2
Ha
%
Neighbourhood area
2760000
276
100%
Public spaces
32.019
3,2
1,16%
PUBLIC SPACE IN
CANAAN II
NAME
16
Buffer zones around
the ravine
Proposed by the
LAB
149.651
14,9
17
Buffer zones around
the ravine
Proposed by the
LAB
23.423
2,3
18
Buffer zones around
the ravine
Proposed by the
LAB
10.399
1
19
Buffer zones around
the ravine
Proposed by the
LAB
8.830
0,88
20
Buffer zones around
the ravine
Proposed by the
LAB
30.298
3,0
21
Buffer zones around
the ravine
Proposed by the
LAB
43.662
4,3
266.263
26,63
9,65%
298.282
29,82
10,81%
Total:
Public spaces and open areas total:
Table 7. Canaan II: Total percentage of public spaces
The World Health Organization (WHO) recommends 9m2/inhabitant
Existing
Proposed
public space
Proposed
P.S + non-aedificandi
9.911 m2
32.019 m2
298.282 m2
12,100 inhabitants
12.118 inhabitants
12.118 inhabitants
0,81 m2/inhabitant
2,64 m2/inhabitant
24,6 m2/inhabitant
Table 8. Canaan II: Public space area per inhabitant diagram
Fig.76: Canaan II: Overall public spaces’ land use and buffer area (400m)
75
UrDI - Urban Structure Plan
C. RESIDENTIAL AREA
2.76 km2
Proposed densities
Neighbourhood area
12,098
Inhabitants
Low density
In the new proposal for density distribution, most of the low-density settlements will be located in the centre of the neighbourhood. Considering that the density is 8,000 inhab. Per km2, Canaan II will be able to accommodate 3,900 inhabitants. Houses
in this classification are often connected to secondary streets. It
is possible to have small shops provided to ensure a good access
to pedestrian paths.
(source ARC household survey 2016)
4,383
people/km2
Existing residential areas
Fig.78: Canaan II: Projected population increase
Medium density
Medium density dwellings in the new plan are located along the
arterial road. The topography in these areas is not so steep and
densification strategies in existing low density areas is thus feasible. The design proposes to have 12,000 inhabitants per km2 in
medium density areas. Respecting the proposed plan, Canaan II
will be able to accommodate 2.280 inhabitants.
High density
For the high density areas, UN-Habitat recommends to have
15,000 people/km2. This means that a study should be conducted on plot resizing and land readjustments before densifying the
neighbourhood. The areas that would be densified are located
where the topography is almost flat. In means to accommodate
the congestion and the increasing number of habitants in these
areas, the high density settlements should have direct access to
the arterial and the main roads.
Fig.77: Canaan II: Existing settlements
Canaan II is considered as a very low density neighbourhood.
With a population of 12,098 inhabitants and an area of 2.76
km2, the density is of 4,383 inhabitants per km2.
76
Fig.79: Canaan II: Contours
It usually advised to locate high density habitats near commercial
activities in order to have a more compact city.
The concentration of dwellings is mostly in the south where the
topography is moderate. In the north, the houses are scattered
and have access to secondary streets.
The new plan for Canaan II is able to accommodate up to 5,950
people in the new high density areas.
U r b a n D e v e l o p m e n t I n i t i a t i v e ( U r D I ) f o r C a n a a n a r e a o f Po r t - A u - P r i n c e
Fig.80: Canaan II: Diagram of population in the new proposed
residential areas.
In 20 years from now, and if the growth of the area remains the
same, it is expected that the current population of 12,098 will
increase up tp 26,508 inhabitants. The densification of Canaan
II, as proposed in the new plan, will be able to host 12,118 people, which is yet not sufficient. In order to cope with the rapid
growth, it is advisable to further densify the areas that are of low
densities and consider planned city extension as well.
The existence of economic activities in the residential areas is
highly recommended provided that they have direct access to the
roads. The size of the commercial activity is strictly linked to the
type of roads they face and the densities; the higher the density
the more commerce are big and vice versa. The compactness of
the cities is triggered by the different land usages in the urban
fabric.
Low density
Medium density
High density
Fig.81: Canaan II: Residential areas and proposed densities
77
UrDI - Urban Structure Plan
D. COMMERCIAL AREAS
Existing commercial
Proposed commercial areas (mixed-use)
33
9,34%
Existing
commercial
points
(of the total
neighbourhood area)
(source OSM)
Proposed Commercial and mixed use areas
0
500
1000m
draft 14.09.2016
Fig.82: Canaan II: Existing commercial points (Source: OSM)
Fig.83: Canaan II: Proposed commercial areas
According to the OpenStreetMap data, there are 33 commercial points in the neighbourhood. The concentration of these existing shops is found in the south where the density of
habitats is high. The information on the types of commerce is absent. To reinforce the local
economy, new commercial services should be considered and strategically located in the
neighbourhood with a good road access.
In the new proposal, the commercial activities will be facing the National Road 1. Also, others
will be facing the new arterial road and will occupy the ground level. These activities have
the potential to generate a new, highly diverse sector within the local economy, with new job
opportunities. They act as catalysts for initiating a structural transformation. The proposed
commercial areas in the new land use plan will occupy 9.34%.
78
U r b a n D e v e l o p m e n t I n i t i a t i v e ( U r D I ) f o r C a n a a n a r e a o f Po r t - A u - P r i n c e
E. PUBLIC FACILITIES
Education plays a major role in reducing poverty and inequalities.
For that, it is always advisable to reserve vacant land for the extension of existing facilities and/or for the provision of new educational facilities. The existing schools are located in the southern
part of the neighbourhood. The data has been validated with the
community but there is still a lack of information on the types of
schools (primary, secondary, etc.). Therefore, it was a challenge
to predict the required number of educational services for the
Canaan II population.
RELIGIOUS - EXISTING
EDUCATION - EXISTING
HEALTH - EXISTING
OTHER PUBLIC FACILITIES - EXISTING
Fig.84: Canaan II: Existing public facilities
and a 500m buffer catchment area.
16%
Less than 10 years
7%
Illiterate
29%
Primary school (not finished)
11%
Primary school (finished)
26%
Secondary school (not finished)
5%
Secondary school (finished)
3%
Professional school
2%
University
Table 9. Canaan II: Participation level (Croix Rouge Americaine, Juillet
2016)
The neighbourhood has places of worship but no information is
available about health services, community centres, security stations and others. For planning purposes, and in order to have a
sustainable city, it is essential to consider the services mentioned
in the new design of the neighbourhood. Generally, they require
good accessibility to the different types of road with good mobility. Normally, it is recommended to locate these services within
500 metres of the houses so they can be easily reached.
Fig.85: Canaan II: Existing public facilities
79
UrDI - Urban Structure Plan
F. NATURAL RESOURCES AND ENVIRONMENT
Given the topography, the presence of quarries and ravines in
certain areas will be considered as no-built for environmental
protection reasons. There is a high potential for flooding in the
centre of the neighbourhood and this is due to the presence of
the ravine. A buffer zone of 50 metres on both sides is therefore designated as a mitigation measure to prevent any risk. This
buffer zone has been designed with the potential to become a
public space. Abandoned quarries must also be converted into
recreation projects to benefit from these lost spaces.
No-built areas will occupy about 34% of the total neighbourhood area.
#
No-built areas
m2
ha
%
Neighbourhood area
2.765.000
276
100%
8
Quarry
31.243
3,1
9
Quarry
140.296
14
10
Quarry
13.031
1,3
11
Quarry
6.677
0,67
12
Environmental risk area
223.269
22,3
13
Environmental risk area
128.555
12,8
14
Environmental risk area
31.268
3,1
15
Environmental risk area
107.271
10,7
16
Environmental risk area
149.651
14,9
17
Environmental risk area
23.423
2,3
18
Environmental risk area
10.399
1
19
Environmental risk area
8.830
0,88
20
Environmental risk area
30.298
3
21
Environmental risk area
43.662
4,3
total:
947.873
95
34,28%
Table 10. Canaan II: Total percentage of no-built areas
Legend
Proposed buffer zone along the rivers and ravines
Proposed area for livestock grazing
Proposed area for reforestation
High environmental risk areas
Existing rivers and ravines
Quarries
80
Fig.86: Canaan II: No-built areas
U r b a n D e v e l o p m e n t I n i t i a t i v e ( U r D I ) f o r C a n a a n a r e a o f Po r t - A u - P r i n c e
G. CANAAN II LAND USE
The assemblies, facilitated by the UN-Habitat team in Haiti, identified the main needs of the residents of Canaan II. The proposed
land-use plan is the result of the ongoing participatory process
with the community. It responds as much as possible to their
needs and proposes new ideas that can induce prosperity and
sustainability.
The plan was reviewed as a whole, taking into account the neighbourhoods nearby and how they connect. It is mandatory to situate each of the individual neighbourhood plans in the whole
Canaan area to achieve a coherent and rich structure.
Fig.87: Canaan II: Proposed land use plan
81